Fourth Quarter 2022 Client Newsletter

After a grueling 2022, the prospect of a fresh start is an opportunity for a glass-half-full moment. In this newsletter, we'll briefly recap what worked and what didn’t in 2022. Then we’ll spend the heft of the newsletter providing a breath of fresh air, economically speaking.
Last year's defining characteristic for the markets was the dramatic decline in bond prices. By the close of the calendar year, the Bloomberg US Aggregate Bond Index (the standard for defining ‘the bond market’) posted its worst performance in its 47-year history, losing -13.01%. Investment-grade corporate bonds posted a -20.44% return. The havens often used to protect investors paradoxically declined alongside in near equal magnitude to their risky asset-class peers.
The carnage in bond land reverberated through equity markets, claiming the highest growth and most expensive stocks as their primary victim. The Nasdaq 100, typically the benchmark used to define those types of ‘growth’ stocks, fell -32.97%, while the more diversely constituted S&P 500 fell only -19.44%. International stocks produced similar declines, although they ended the year with impressive relative outperformance.
Cash priced in US Dollars, gold, energy, and a few other commodities were the only assets that made it out unblemished in 2022. Pockets of stocks in sectors like healthcare and consumer staples produced gains in 2022.
We say good riddance to 2022.
The tough years are the reason why we’ve developed the strategies we offer. We feel fortunate to have avoided much of the year's widespread destruction.
We’re always here to discuss our outlook, strategy, and positioning whenever you’d like. Please do not hesitate to set something up.
Best of luck in the new year,
Kyle
What could go right?
Negative scenarios are simple to conjure and can be so logically captivating that they claim the entirety of our focus. It's not always our fault for falling victim to their spell. Risk aversion is an evolutionary skill. After all, if your ancestors tempted fate by foraging too close to a bear den… they became dinner.
Financial markets push our paleolithic brains down that same path – to survive is to understand and respect risk.
That said, I've never been more confident that our readership is acutely aware of where things can go wrong. So if you feel pessimistic about the state of markets and maybe the state of the world, take comfort in knowing that you have plenty of company.
When sentiment gets as extreme as it has become, it's worth assessing the opposite view. Even if you’re convinced all hope is lost, let’s play the game 'what could go right?'
Before jumping into the details, let’s review some readily agreeable, overly simplified facts about where we are in the cycle. Listed roughly in chronological order:
- Inflation is too high,
- In response, the Federal Reserve and other central banks are tightening monetary policy by raising interest rates,
- Interest rates have reached levels not seen since the mid-2000s/1990s,
- Economists expect high-interest rates to eventually weigh on economic growth,
- Slower economic growth means businesses will be less willing/able to raise wages or maintain current staffing,
- Stagnant wage growth and rising unemployment will slow consumer spending, solving inflation.
- OR -
- The threat of such a dire economic outcome will cause you, the informed consumer, to cease or slow discretionary spending, solving inflation.
It's not hard to see why pessimism rules the day. In the simplest terms, central banks can curtail economic growth with their words and actions. And for the past 8+ months, they've been stating in no uncertain terms that inflation is unacceptably high, and they must act.
One critique of the timeline above is that maybe wage growth isn’t what’s driving inflation. That line of rebuttal would probably include a discussion of supply chain chaos, goods/services demand differentials, etc. But that time has passed, and the Federal Reserve no longer has time to care about transitory/lingering pandemic relationships. To maintain credibility, they think they must stay at a restrictive policy rate for the foreseeable future.
Let's turn to the data and see if we can apply any 'yeah, but' optimism to how the current economic dilemma translates. It only makes sense that we start with inflation.
To measure the inflation rate, we can relate the current prices to one month ago or one year ago. Or we can use survey data to tell us how suppliers and consumers feel about future prices.
Inflation related to specific types of goods and services has been an excellent way to gauge where the most significant demand/shortest supply has been during the pandemic. The gyrations have been dramatic.

Prices for a basket of goods in November 2022 rose 5.9% versus November 2021; services prices rose 8.9% over the same period. There is zero room for debate that both year-over-year readings are unacceptably high relative to central bank targets.
On the other, more positive hand, why should we be hyper-focused on year-over-year inflation?
If a student gets straight A's this semester, would you still yell about their failing grades from November 2021?

The annualized trajectory of monthly and quarterly inflation data is nearly at central bank objectives, and upcoming Consumer Price Index data is expected to begin posting negative month-over-month readings. So, our lackluster student from a year ago might be well on their way to the top of the class.
The most frightening prospect for a central bank is that inflation expectations might become entrenched. Once consumers and producers expect inflation to be high and stay high, it tends to do just that (see the 1970s).

Consumer survey data do not indicate inflation expectations have become unanchored from Federal Reserve's targets. Regional surveys of business leaders also show expectations that prices will continue to fall.

That’s good news!
The first 11 months of the Federal Reserve tightening cycle that began in 2022 have been the fastest on record. Hikes at every meeting of the year took overnight interest rates from 0.25% to 4.5%. They’re likely on their way to 5%-5.5% this year.

Relative to all other restrictive policy cycles, the 2022 iteration stands out in speed but not magnitude. The experiences of 1972 and 1976 remain potential nightmare scenarios; luckily, inflation data does not look like it did back then.
Will a 5.5% federal funds rate kill the economy? We'd guess probably not; It's about average. Yields on longer-term government debt have also remained below long-term average levels. Larger debt loads worldwide will make these 'normal' interest rates more burdensome, but that's unlikely to be a problem in the next few years.

Spending money on higher interest expenses isn't very much fun, especially if you're accustomed to the lowest rates in the history of man. But the marginal difference between zero and a less-than-average level of interest isn't likely enough to break the back of many businesses or consumers.
In the past, we've felt that somewhere between 4% and 6% on intermediate-term US treasury bonds is likely where things get more difficult economically and for markets. Interestingly, that's about where rates peaked in early October; since then, markets have found a more resilient temperament.

The negative correlation between 2yr interest rates and the S&P 500 remains as strong as ever. It might be a new year, but the relationships of 2022 are holding firm in the first weeks of 2023. Asset allocators will be wary of another year of falling stocks and bonds; traders will rejoice.
Despite overwhelmingly negative earnings outlooks from the strategist community, bottom-up earnings are currently slated to grow more than 4% in 2023. If estimates are revised lower throughout the year at a typical rate, we should expect S&P 500 operating earnings will be roughly unchanged from 2022, at around $219/share.

Index-level earnings are tough for us to put a positive spin on. The inflationary impulse of 2021/2022 allowed companies to aggressively raise prices, while fiscal stimulus and a capital spending boom drove revenues. Those broad-based catalysts are receding, so a stagnant year of corporate earnings is the most favorable outcome we can champion. However, don’t forget that profits have compounded at a whopping +14% per year since the pandemic's onset.
Forecasting markets one year out is a notoriously tricky task that routinely makes intelligent people look like fools. Still, come January every year, strategists, asset managers, and analysts put pen to paper on their predictions.
Our highest probability prediction for 2023 is the same as it was in 2022 - keeping a close eye on inflation will be the most effective way to not lose your head.

As of 12/31/22, the S&P 500 would need to rally more than 24% to regain its previous all-time high of 4793. Conversely, a fall of 9.1% would result in a retest of the intraday low made on 10/13/2022. If we stay between the high and low of 2022 and (optimistically) assume $219/share of 2023 earnings, we’d experience a price-to-earnings ratio of between 16x and 21x.
Neither of those is a particularly cheap valuation multiple. The S&P 500 has only sustained a 20x multiple in two periods: one was the Dot Com Bubble of the late 1990s, and the other was during the stimulus-induced frenzy two years ago. Justifying a 20x multiple is going to be very difficult. So. What can we expect?
Remember, we’re being optimistic… Here are a few market scenarios for the year, two are favorable, and one isn’t.
- Door number 1: Back to Normal -The drivers of inflation turn out to have been transitory after all. The Fed realizes they’ve won their war with inflation and pauses rate hikes before having inflicted too much damage on the global economy. Stock and bond markets anticipate a return to the stable growth and low-interest rate regime that precipitated the 2010-2019 bull market. The roaring ‘20s have a belated beginning, and a new secular bull begins. S&P 500 sets new all-time highs in 2023.
- Door number 2: Consolidate and Confound - Inflation continues to fade, but not quickly enough to keep the Fed from continuing its march towards more restrictive policies. The cumulative effect of their tightening causes sluggish growth and a shallow recession. Investors lack confidence in stocks throughout the year as fixed income offers a ‘good enough’ yield to warrant haven demand. Despite investor gloom, no concerted selling pressure materializes. S&P 500 meanders in the trading range from 2022: much like the consolidations in 2011/12, 2015/16, and 2018/19
- Door number 3: Optimism is Pointless – At the end of the newsletter, you’ll find a table that details the economic and market declines experienced in prior recessions/bear markets. It’s a choose your own negative outcome adventure. But as you do, keep in mind that the S&P 500 already experienced a -26% drawdown in 2022.
Whatever your outlook for the next 12 months, buckle up; it’s likely to be a wild ride.
Recession Watch – From Great to Good… Now what?
In September of 2021, we wondered if going from ‘great to good’ had to be ‘all bad.’ What might happen when the stimulus-fueled economic boom receded? Would returning to average, real-world-driven economic growth feel like a recession? Even in the face of what would have been viewed as normal growth five years ago?
Eighteen months later, we can confidently say that yes – by all measures, people feel like the US economy is or has been contracting. That’s interesting since at no point since the pandemic shutdown has the US economy posted negative year-over-year economic growth. Even more interesting, unemployment in the United States is at a 50-year low, and the US Economy likely grew real GDP by nearly 4% in the 4th quarter!
Yet here we are, on the cusp of the most anticipated recession of all time.
Forty-three percent of economists see a recession coming in the next 12 months. The highest ever.

Market-based measures like inverted yield curves are among the few indicators that have predicted every recession, though their use as a recession timing tool has been less than stellar. Either way, nearly the entire front of the US yield curve is currently inverted.

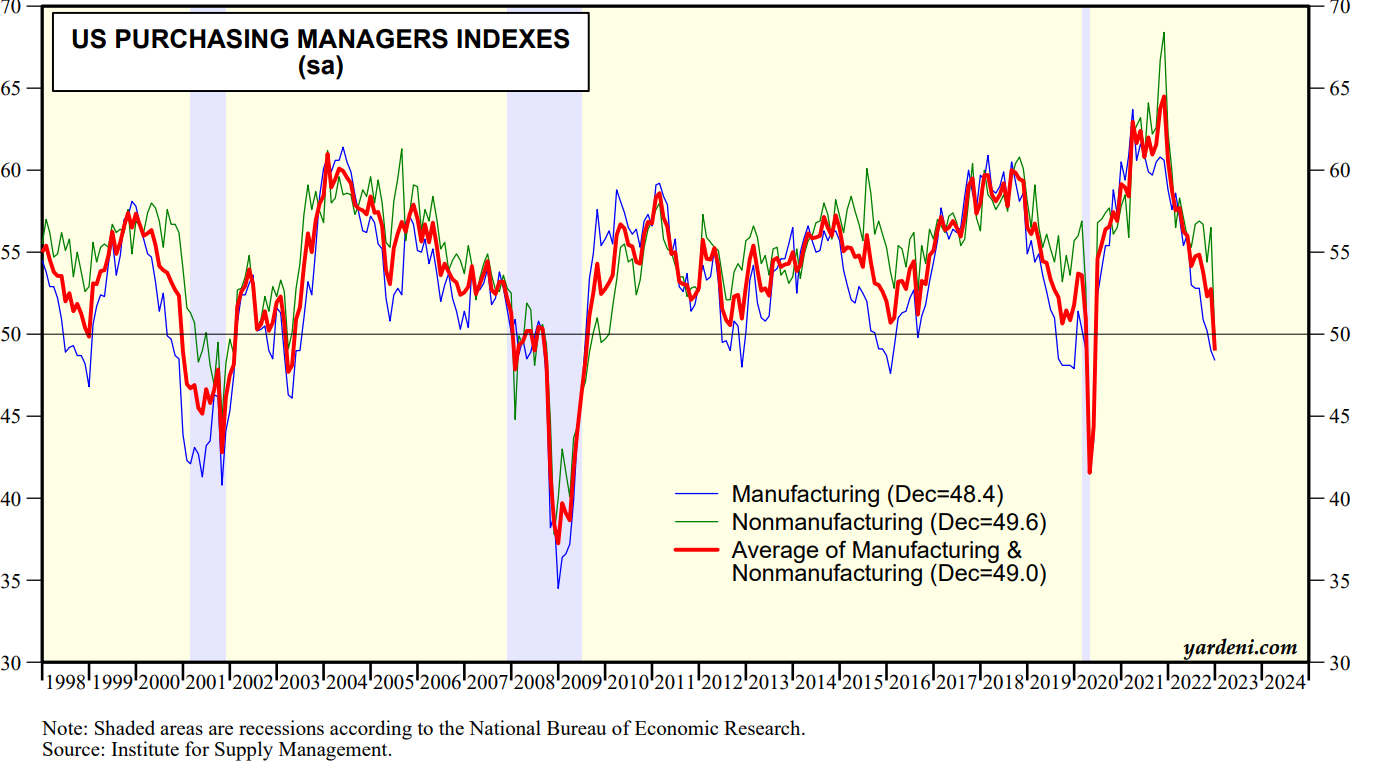
A composite of leading economic indicators has been used to predict the economy's direction accurately. As you probably guessed, the index is signaling contraction (blue).

Surveys of business managers have also had some predictive value. Again, below 50 signals contraction. And they’re below 50.
Once people lose their jobs and collect unemployment for an extended time, you can be pretty sure the economy is in contraction. While the absolute number of people collecting unemployment insurance remains quite low, the recent increase has reached a magnitude that has always signaled a recession. Historically, the labor market doesn’t move in small increments – things are always getting much better or much worse.

Flashing red lights for an incoming economic contraction are found all the way down the flag pole: Economist predictions, fixed-income markets, a composite of leading economic indicators, business manager sentiment, and rising unemployment claims. It’s truly an unprecedented setup.
It’s rare in financial markets/economics that all indications point to one outcome. When it happens, market participants tend to take the warning skeptically; many folks will even take the opposite side of the signal entirely. Maybe in some cases, it’s arrogant self-confidence. But more often than not, it’s because preparations are already underway to deal with that potential outcome. Knowing something scary is on the way can be half the battle.
In this case, the drawn-out always-right-around-the-corner recession may have allowed business leaders time to plan for slower growth. While firing staff and cutting expansion projects could lead to a self-fulfilling economic slowdown, fewer businesses caught off guard by the slowdown should help offset the risk of a more protracted decline.
It’s also worth considering the nature of the industry-specific booms and busts over the past three years. Deep contractions in one industry tended to coincide with massive expansions in others. Historically, recessions don’t work that way.
Perhaps this unique way of having an economic slowdown will stave off a textbook broad-based slowdown in economic activity. It wouldn’t be the craziest thing that’s happened in the past three years.
The Fog of COVID:
- Initial health-related shutdowns (3/2020-7/2021) – Reopened.
- Urge to buy a peloton, make sourdough, and watch Tiger King (3/2020-4/2020) – Over, hopefully.
- Sharpest and fastest recession/recovery in US history (3/2020 – 4/2020) – Ancient history.
- Stimulus payments, PPP, and expanded unemployment benefits (3/2020-9/2021) – Spent, mostly.
- Port congestion from the surge of goods demand (6/2020-9/2022) – Ports open, costs normalized.
- China lockdowns and resulting supply chain issues (3/2020 – 10/2022) – Reopened.
- Imminent Global Recession (9/2021 - ???) – Pending
What if indications of an unavoidable deep recession are simply the final pandemic distortions playing out? Could the last traces of fog lift off the road to reveal the world we knew before?
An optimist might say maybe.
Conclusion
Thank you for taking the time to review our 4th quarter newsletter. We hope we were able to convincingly convey some positive perspectives on markets and the economic outlook. Optimism doesn’t solve everything, but it feels like an excellent place to start the year.
We expect the coming year could be just as challenging as 2022. And we’re prepared to continue making good on our risk management mandate(s).
As always, if you’d like to continue the conversation, please let us know.
