
Portfolio Management Newsletter #46
Clients and Friends of Mader Shannon,
It’s been about a year since we published a Portfolio Management review. Throughout the second half of 2025, we continually prepared and scrapped newsletters. Each time, concluding that things were going so well that nobody cared to talk about the markets. The phenomenon seemed to align with the Ben Franklin quote, “Well done is better than well said.”
After a bumpier, but still fruitful start to 2026, we feel like we’re due to get back to our prior publishing cadence. In this catch-up newsletter, we’ll run through a rapid-fire review of prominent themes and events. We’ve done our best to keep coverage timely, despite the ever-present risk of a narrative-changing tweet.
In addition to returning to a more regular publishing schedule, we’d like to solicit some feedback. We’re curious what kind of newsletter coverage might best suit you? Given our broad strategic offerings and diverse client base, we’re restricted from discussing positions or performance directly. But would you be most interested in quick-hitting monthly market updates? Periodic deep dives? A sprint through the major themes? Please share your thoughts if you have a preference. We’ll do our best to incorporate feedback into our ongoing communication strategy.
And as always, if you have any questions about the markets or you’d like to schedule a more in-depth review, please reach out. We’re here to help, and hope you enjoy this mid-year update,
- Kyle and the Portfolio Management Team
War and Oil
Now that the war is over (?), it’s time to recap why the largest energy supply shock in history didn’t have an extraordinary impact on commodity prices.
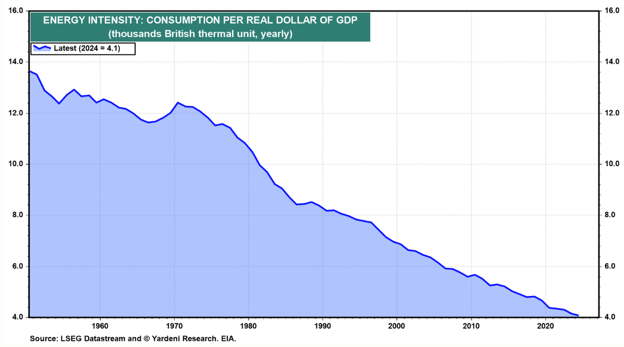
Since the last comparable energy shock (the 1970s), the American economy has become 3.5 times more energy-efficient. Technological advancement, both in the consumption and sourcing of energy, has played a significant role. A shift towards a services-oriented economy has also helped drive energy intensity to successive new lows decade after decade.
The price of oil rose by more than 1,000% in the 1970s. In the four-month Hormuz shutdown of ’26, prices merely doubled. There’s almost no comparison to the two periods, especially adjusted for the energy intensity of the U.S. economy. Recessions are shaded in red, note that one almost always occurs after a sustained spike in crude oil.
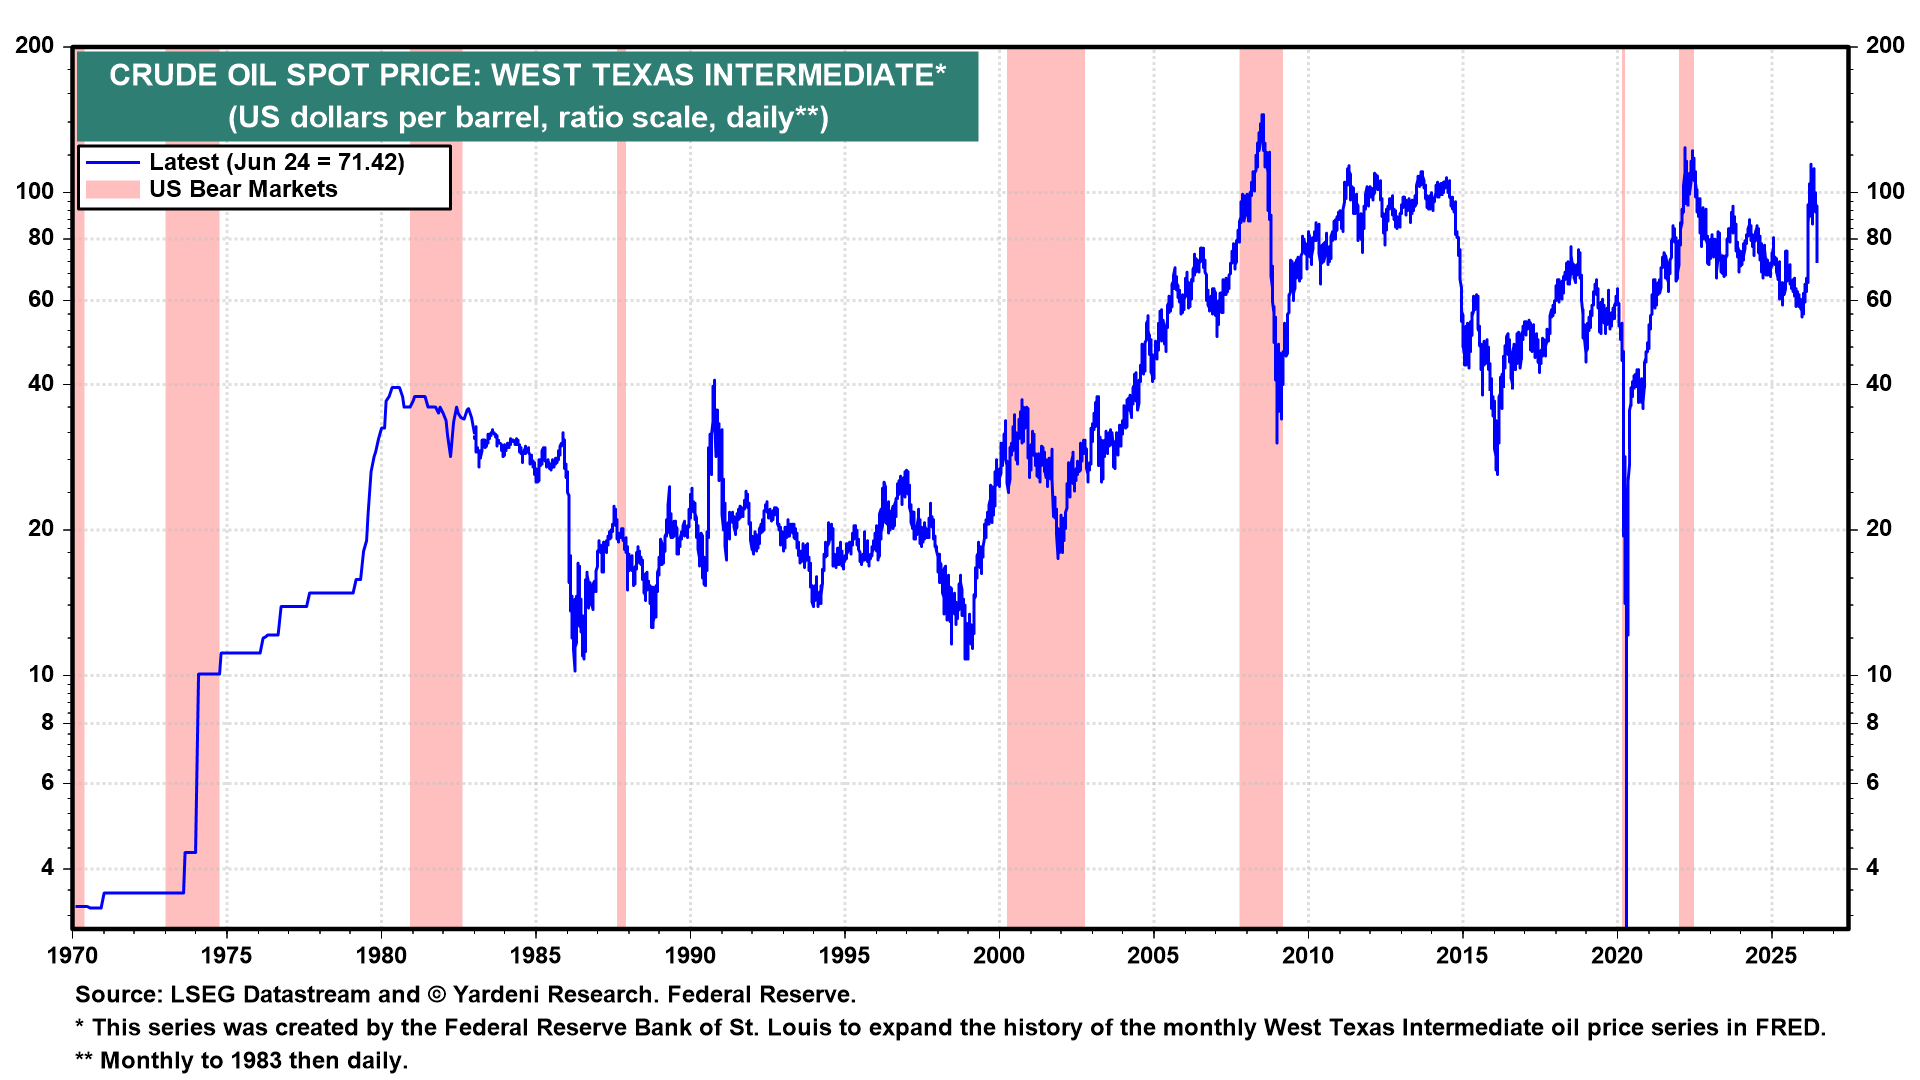
A closure of the Iranian waterway (the Strait of Hormuz) has long been a nightmare scenario. Energy markets are finely balanced, and even marginal changes in supply or demand can cause wild price swings. So, how did the world mitigate a multi-month global oil supply loss of 20%?
Demand destruction in OPEC-dependent countries, principally Asian economies, played a major role. Eventually, fuel prices outstripped consumers’ ability or willingness to buy. Or there simply wasn’t crude/products on the way. Energy imports to Japan and China tell the story well enough for this discussion.
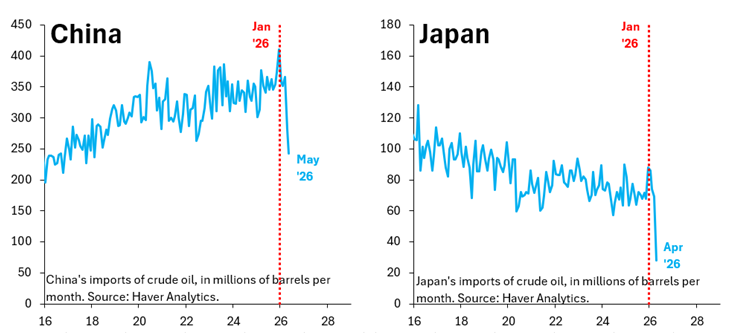
Chinese imports fell by more than a third, while Japanese imports fell by more than two-thirds. Luckily, both countries were able to either restrict economic activity or, more importantly, tap strategic reserves to patch the import shortfall.
Next, resourcefulness in moving crude through pipelines and covert Hormuz shipments helped mitigate supply shortages. It’s impossible to chart, so we won’t try. The most credible estimates we’ve found suggest that about 3 million barrels per day (down from a normalized 20 million barrels per day) were transported in novel ways. If there’s a silver lining to this whole event, it’s that Gulf states are now incentivized to invest in reducing reliance on Hormuz by expanding pipelines to the east and north of the Strait. Hopefully, this episode can be an isolated event.
Lastly, the U.S. boosted exports and released barrels from the Strategic Petroleum Reserve. And by relaxing the Jones Act (a law that restricts intra-US maritime shipments), abundant supplies in the U.S. Gulf Coast could be shipped to the U.S. east/west coast. The combined effect was that our partners in Europe and Asia suddenly could source products from the U.S. The overarching strategy to buy time and mitigate the worst-case supply shortage scenarios appears to have worked.
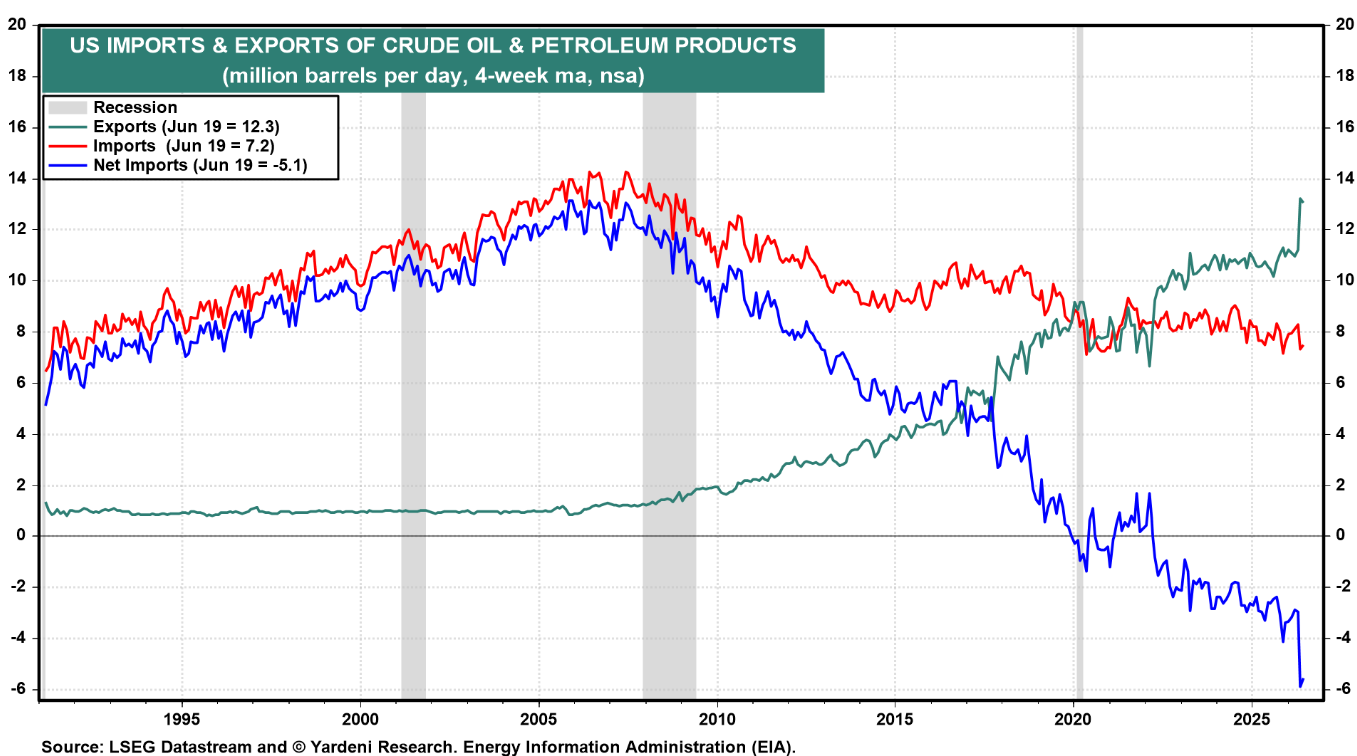
Note the nearly 20% overnight uptick in crude/product exports (green line). In the past 15 years, the USA has gone from one of the largest importers to one of the world’s largest net exporters of crude oil/products.
As of this writing, the oil/gas tankers that have been trapped on the western side of Hormuz are free to move. As you’d expect, they’re headed to open water as fast as possible. That’s good news and will kick off the months-long process of restocking inventories worldwide.
Though questions remain. Once those ships’ payloads reach their destination, will they head back through Hormuz to reload? Or will they fear being stuck again if hostilities resume? Will Persian Gulf energy flows and trade routes regain their original form? Or has the world changed in a major way? How will Iranian/Omani desires to collect tolls impact traffic and negotiations?
Inflation 2.0?
I despise overused quotes almost as much as I hate charts that overlay multiple data series. The former is lazy, and the latter can be used deceptively. So, you’ll have to trust that this opening inflation vignette brings me great pain.
The Great Inflation of the 1970s was driven by consecutive energy shocks and a decoupling of inflation expectations by the American public.
The inflation of the 2020s has been driven by a supply-and-stimulus shock, followed by successive energy shocks. Ugh, “history doesn’t repeat... but it rhymes.”
The chart below shows the ‘Great Inflation’ period in blue, and the current U.S. inflationary trajectory in red. They share an eerily similar flight path.
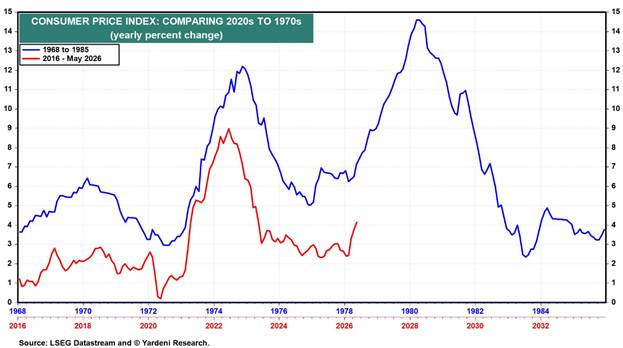
As discussed in the segment above, the energy dynamics that drove the ’70s inflation sound similar to those of ’26, but really do not compare in magnitude.
While inflation expectations in ‘26 have not decoupled, the dispersion between Democrats and Republicans remains as wide as ever. As the University of Michigan sees it, Dems expect inflation to rise at a 4.9% rate over the next year, Rs see 2.1%. The lower chart shows expectations for the annual inflation rate over the next five years.
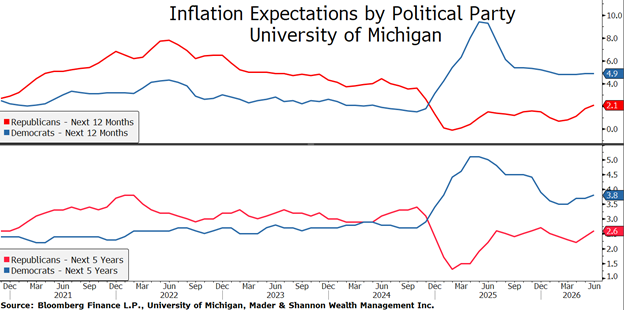
It gives us pause that Republicans are slowly but surely raising their expectations. Though in the aggregate, inflation expectations are still well within the normal range. That’s excellent news, since expectations remaining anchored has been the Fed’s sole source of pride in these tough post-pandemic years. More on monetary policy in a moment.
If you remove the impact of the volatile food and energy components, you’re left with what we call Core Inflation (black line). At under 3%, that figure isn’t nearly as problematic as the >4% inflation rate on headline CPI. One step further, if you use statistical methods of stripping out the most extreme components (trimmed mean/median), inflation looks downright subdued.
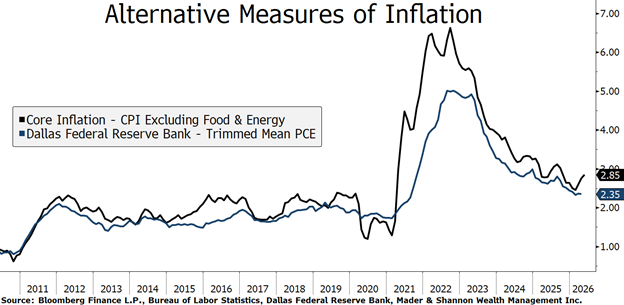
Some recent studies have questioned the usefulness of trimmed-mean/median inflation data for predicting future inflation. But no mind, newly appointed Chair Warsh has espoused some affinity for the statistically moderated flavors of inflation data, so we’ll keep them on the radar.
The final chart in this segment warrants a nerd alert, but it’s too timely to ignore. Inflation breakevens (market pricing of future inflation outcomes) have come tumbling down since the end of U.S./Iran hostilities.
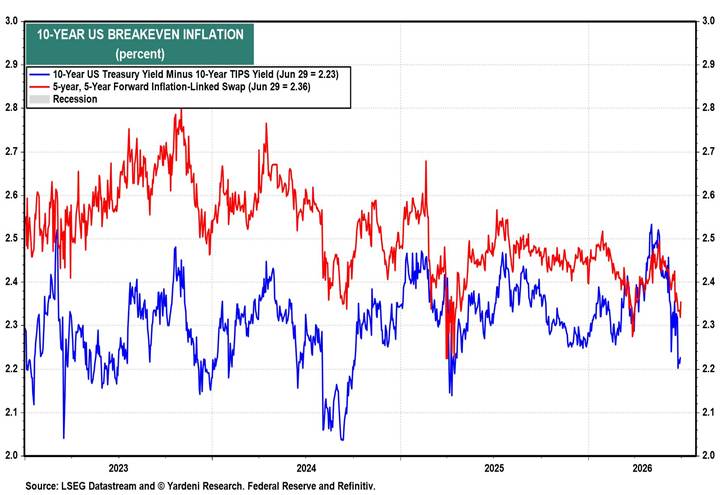
That’s potentially good news for everybody, especially the new Chair of the Federal Reserve. Let’s review the conundrum(s) he faces in his new role.
Welcome to the big chair, Mr. Warsh
The lineage of modern American Monetary Policy is officially broken. For four years, from 2002, Bernanke served as a Governor to Greenspan’s Fed. For four years, from 2010, Yellen served as a Governor to Bernanke’s Fed. And for six years, from 2012, Powell served as Governor under the Bernanke, then Yellen Fed.
Each of their tenures as chair seemed to build directly off the reign of their predecessor. Policy seemed coherent, and communications grew ever more transparent. That chain is broken, as might be the 20+ year playbook for Fed Watching.
Sure, maybe that’s a bit dramatic. Chair Warsh is thoroughly qualified, and he did serve briefly under Bernanke during the Great Financial Crisis. He’s well educated and respected by market participants. In his inaugural meeting as chair, it’s clear he’s embracing the role of reformer.
His opening move was to begin a full assessment of how the Federal Reserve operates. Five concurrent task forces/committees were launched: Communications, Balance Sheet, Data, Jobs, and Inflation. Each is led by a mixture of internal/external multi-disciplinary experts. He hopes that the task forces will bear their findings by the end of the year. That’s a fast turnaround by Fed standards.
During the nomination process, it seemed that Warsh had found new religion in Monetary Policy. A relative inflation hawk during the commodity supercycle of the mid-2000s, Warsh was suddenly espousing patience with elevated inflation in hopes of a supply-side productivity boom driven by AI. It seemed that an accommodative policy stance was on the menu!
Then, another shock. This time in the form of a conflict between the U.S./Iran. Energy prices shot up. From an academic perspective, monetary policy makers are taught to ignore geopolitical shocks. After all, how can a central bank solve a commodity shock or violent conflict? Of course, they can’t, so they should stay out of the way.
But when you have a ‘one-off’ inflationary event every year (pandemic shutdown, supply chain crisis, stimulus boom, Russia/Ukraine, tariffs), the inflationary impact starts to add up. As Fed Char Powell seemed to feel in his final meetings, it’s just one damn thing after another. Warsh seems to share that feeling.
Warsh spent the bulk of his most recent press conference fielding questions on Fed operations and communications. It was almost a waste of time. He shared shockingly little about how he sees the labor market or inflation dynamics. Even the very timely news of peace between the U.S./Iran was somehow overlooked. Instead of any substance, he repeatedly said he intends to return inflation to the Fed’s 2% target. He showed complete deference to the committee when discussing the policy and macroeconomic outlook.
The members of the FOMC are evenly divided: half see a need to raise rates, and half prefer to cut/stand pat. That seems easy enough to diagnose – qualitatively, U.S. monetary policy is roughly neutral.
The markets, on the other hand, are priced for a more restrictive policy. The Federal Reserve’s policy rate (Fed funds) is shown in green below. Remember, higher rates = more restrictive policy. The blue line shows how markets expected interest rates to play out before the Iran War; the red line shows current market expectations for the policy rate.
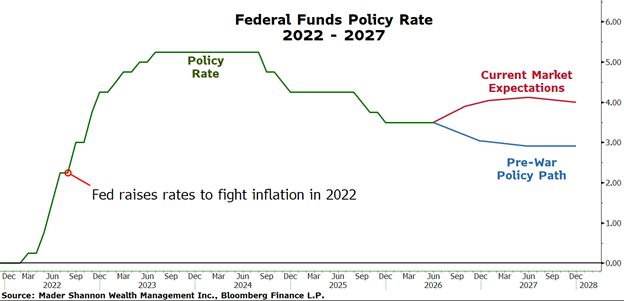
In response to the war and resulting rise in commodity prices, the markets have tightened policy by more than 1%. That’s a dramatic shift in a four-month window. In a way, markets have done some of the Federal Reserve’s hard work by raising borrowing costs in the real economy.
From a big picture perspective, that’s almost certainly what Mr. Warsh prefers. By withholding forward guidance, the Fed will allow rate markets to set their own course. It will be more difficult to know at any given moment if markets have over- or under-tightened relative to forthcoming policy.
Will Mr. Warsh appreciate it when markets erratically adjust to policy surprises? As he’s fond of saying, we shouldn’t prejudge.
The Great Stabilizer(s) – AI and Fiscal Spending Buoy the Ship
Everything is AI
We wrote a draft of a piece called ‘Everything is AI’ last year. The piece compared the AI investment boom to the pandemic phenomenon of ‘Everything is Cake.’ In that trend, as you likely recall, normal-looking everyday items were shown to be, upon further inspection, cake.
In that abandoned write-up, we reasoned that all sorts of companies looked like AI companies – the ones that spend to train large language models, sell IT components, and build data centers are obviously AI.
But what if you figuratively cut open normal-looking companies? Would you find that bureaucratic health care, business services, consumer goods, and a whole host of other industries are actually AI, too? We think so.
The biggest long-term winners in the AI theme could well be the companies that successfully deploy the technology for efficiency and productivity gains. As the investment phase transitions into real-world implementation, broader cohorts of companies could become the real winners. But that’s a story for another day.
Today, we want to highlight the staggering scale of capital spending and the stabilizing effect it’s having on the economy more broadly.
Every quarter, the “hyperscalers” (Microsoft, Google, Amazon, Facebook, Oracle) report their earnings. And every quarter (somehow) they raise their capex guidance – now expected to exceed $800 billion over the next twelve months. Shortages and intense competition for chips and data center components are driving prices higher, and these tech giants are willing to pay whatever it takes to win the arms race.
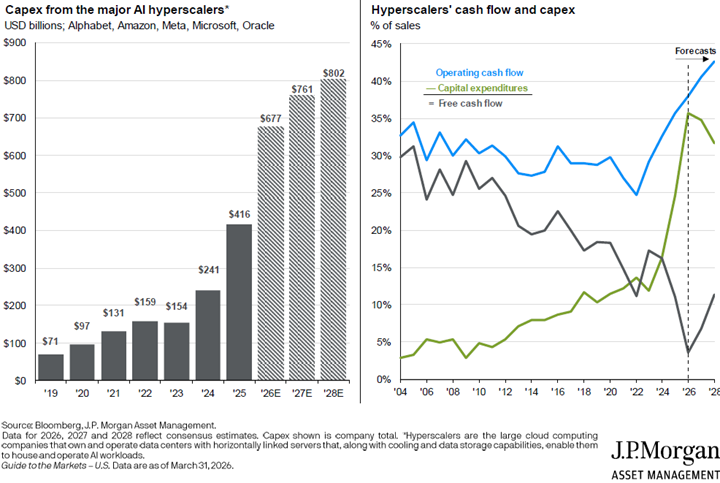
The spending binge and resulting revenue create a fascinating accounting mismatch within many market datasets. Stick with me, I promise, accounting can be fun.
When a company deploys capex, it’s an investment in a future asset. Under accrual accounting, that cost is recognized only as the asset is used up (through depreciation). So, cash flies out the door today for the Hyperscalers, but no immediate expense is reported. From a net income standpoint, the investment is practically invisible.
Conversely, the companies supplying semiconductors, cooling systems, power generators, and construction labor recognize that revenue immediately. It’s the equivalent of selling umbrellas in a thunderstorm; you’ll sell out of merchandise no matter how high a price you set.
The result? At the aggregate S&P 500 level, this timing mismatch shows up as hundreds of billions in immediate revenue and earnings, offset by zero dollars of immediate expense. Is that an inherent problem? Not necessarily, but something to be aware of as the investment cycle matures.
Beyond the company and market impacts, the spending surge is stabilizing the broader U.S. economy. To put it in perspective, let’s compare this cycle to historical investment booms. The PC/internet expansions and the 19th-century railroad booms each reached nearly 3% of GDP per year at their peak.
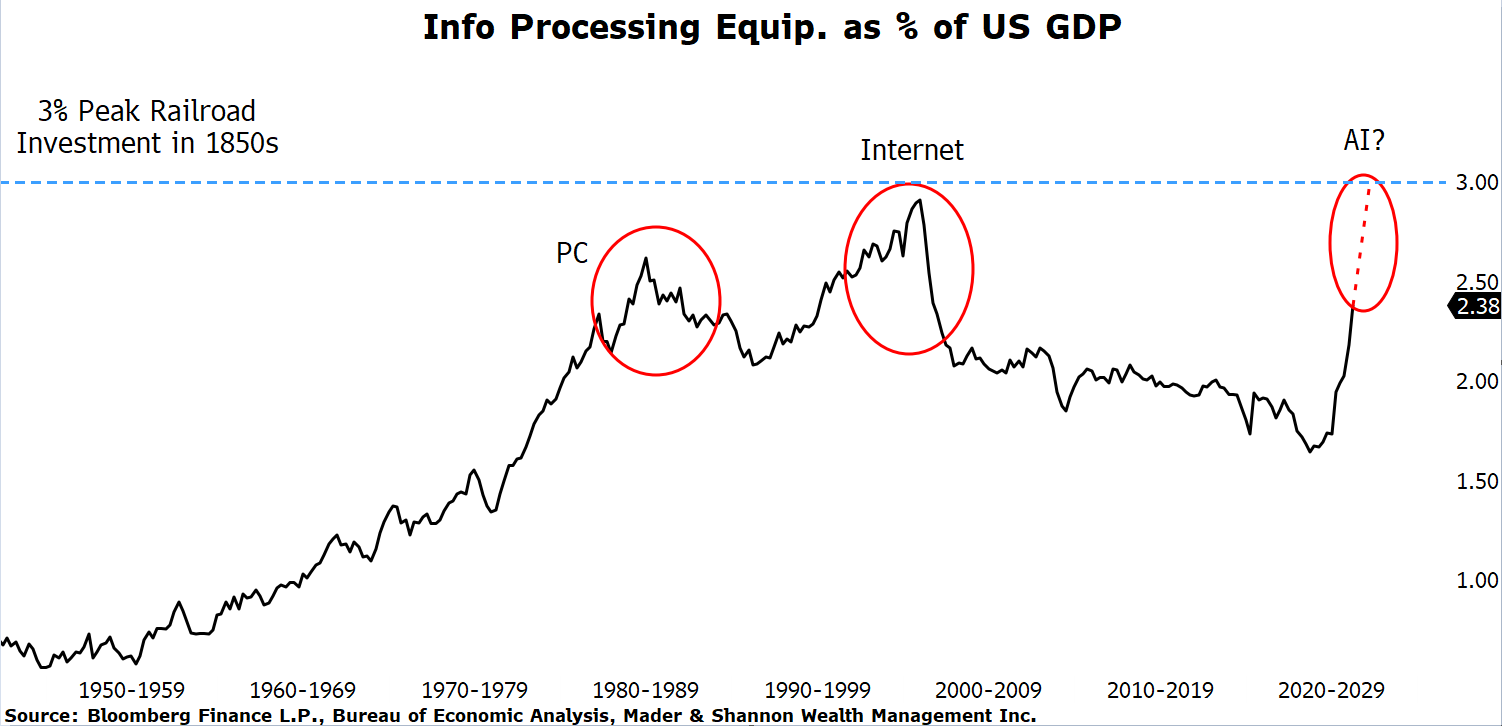
We are presenting this chart as a glass-half-full. Sure, those historical investment cycles eventually ended in overbuilt capacity and capital destruction. However, they did two vital things first: they provided immense economic stability during their investment phases, and they laid the physical infrastructure that served as the springboard for sustained, long-term economic transformation.
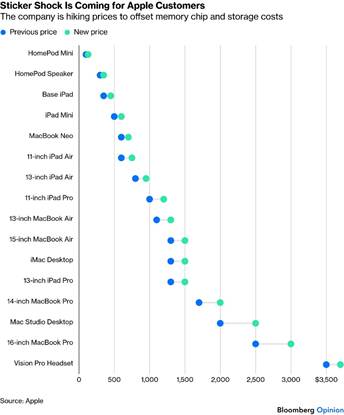
By most experts’ reckoning, the buildout is years from reaching maturity. If that’s the case, you should probably expect more shortages and higher component prices. Some of those pricing/availability issues may even flow through to goods and services you’re in the market for.
Jeff Bezos famously said that other businesses’ margins are his opportunity. Well. Tim Cook just told you that his margins are your problem. Costs for memory components have recently skyrocketed, and Apple product consumers will foot the bill.
Ultimately, the hope is that the trillions of dollars in capex will yield even greater aggregate value, and that the disruptive, inflationary pressures of this spending boom will be outweighed by broad economic stabilization.
Whether these AI investments prove fundamentally sound and how their inflationary impacts will shake out will undoubtedly be a story for many, many newsletters to come.
Uncle Sam Has Your Back
Another piece we wrote and scrapped last year was called ‘Run it Hot.’ In it, we discussed an emerging preference among policymakers in the U.S. and abroad for above-trend economic growth and a disregard for modestly higher inflation. It’s not a novel preference historically. The ‘Run it Hot’ mentality can provide a much-needed boost of confidence during economic stress.
It’s a bit rarer to have policymakers pushing for growth at any cost in a period of full employment, healthy equity markets, and wide-open lending standards.
As a percentage of nominal GDP, the U.S. budget deficit is -5.2%. Put another way, the U.S. Government’s excess spending adds 5.2% of GDP to the economy each year. For the GDP calculation sticklers, yes, we understand that not all of that deficit spending will be represented in the GDP accounts. We’re simply using GDP as a measure of scale.
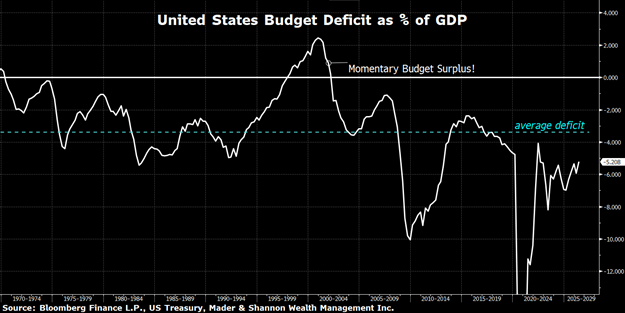
Secretary Bessent hopes to get the budget deficit to -3% by the end of 2028. That’d be back to the long-term average. Not exactly a restrictive or budgetarily disciplined number, but hey, improvement.
Unfortunately, getting much beyond 3% is going to be tough, since interest expenditures account for an increasingly large share of the deficit. Sorry to say, but the U.S. Government now spends more than $1 trillion per year in interest expense.
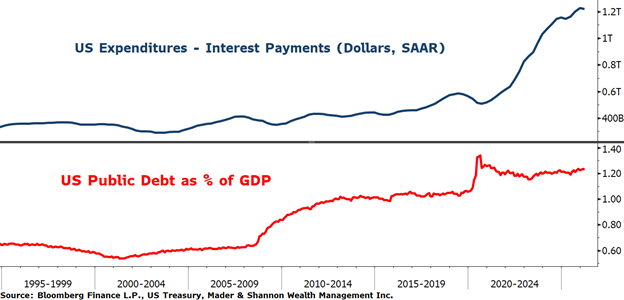
I’m not going to sugarcoat things. The debt situation in the U.S. and other developed market economies is concerning. Though it’s far from a new problem, so let’s not get stuck in big-picture land.
From a short-term perspective, consider that American households and institutions hold a majority of the U.S. debt. That means most of that $1.2 trillion in governmental interest expense is showing up as interest income on domestic income statements.
That no doubt feels like stimulus to those entities, because it is. If the Federal Reserve can keep from clamping on the policy brakes in response to higher commodity prices, we’ll officially be in a ‘Run it Hot’ economy.
