This is certainly one for the history books, the entire world brought to a halt by a dangerous virus. We at Mader & Shannon want to extend our gratitude for your trust in us with your nest egg during this crisis. Bret and I want to express our absolute appreciation for the exceptional work from our portfolio management team. Kyle and his team have truly outperformed in every way. They continue to execute on a strategy based first on risk management and the mandate from our clients that preserving capital is as important as growing capital. Congratulations, we so appreciate your judgement and successes on everyone’s behalf.
-James W. Mader, CEO.
_________________________________________________________________________________
First Quarter Portfolio Management Newsletter
Given our lack of medical training and the pervasive news coverage focused on the health crisis, this note will not focus on medical developments or infection statistics. If you’re looking for more of that type of coverage, we’d be happy to point you in the direction of some of the most influential and informed voices we’re following.
Instead of the health crisis, this newsletter will concentrate on the current economic predicament we find ourselves in. We’ll be looking into the technical ramifications influencing markets and the fundamental realities that companies are facing.
In case you’re not going to read through the entire newsletter, let me spoil the ending: everybody is flying blind right now. Whether you’re amongst the scores of newly unemployed, a business manager trying to balance the books, or an economist trying to forecast GDP, there is little doubt that we’re all trying to grapple with an unclear picture of the future. This pervasive uncertainty is typical of recessionary periods and tends to resolve with time and persistence. We don’t expect this recession and recovery to be any different.
As an active manager, we feel exceptionally well suited for this moment. The environment is completely without precedent - but this is not the first time our management style has met an unprecedented challenge. We’re confident that throughout this recovery and rebuilding phase, we can continue to offer both peace of mind, as well as excellent risk-adjusted returns.
As always, we’re here if you have any questions,
Kyle
Crisis Response – Fiscal and Monetary
Fiscal – Congress
After a wholly disappointing and inadequate response to the 2008-2009 great financial crisis, Congress took up arms against the Coronavirus Crisis with breathtaking speed and force. In many ways, the memory of the lackluster economic recovery post-financial crisis likely influenced this rapid response.
A great deal of information is widely available about the finer points on the CARES Act and attached supplemental bills, so in this section, we will briefly summarize the objectives of the programs. The program(s) had three main goals: get cash directly to every man, woman, and child (‘money in the mail’), provide grant money to small businesses (paycheck protection program or PPP), and loosen a sweeping list of regulations and restrictions that would allow for more liquidity in the financial system. When you consider that these bi-partisan programs were dreamed up and implemented during about two months, it is tough to say that they have been anything but successful.
So far, the total fiscal response to the coronavirus crisis has totaled about $2.8 trillion. For some perspective, let’s look at a few other notable periods of fiscal spending in our nation’s history:
- The US Interstate Highway System was put into motion by President Eisenhower in 1956, and cost about $521 billion in today’s dollars.
- The much-revered Marshall Plan to rebuild Western Europe after WWII is estimated to have cost about $128 billion (although there were follow-up bills that allowed for additional spending to support our military allies abroad).
- Last, but certainly not least - according to the Congressional Research Service, the total inflation-adjusted costs of WWII attributable to the US Government were $4.1 trillion.
Any way you slice it, the programs implemented by Congress over the past ten weeks are massive and without compare. And it is very likely that more will need to be done. For now, the potential routes include infrastructure spending, additional rounds of ‘money in the mail’ and/or PPP, supplemental aid to States, or potentially something even more creative that has yet to be brought into the public debate. Whatever the program might be, it will likely bring an additional $1-2 trillion in spending. All told, our total fiscal response to this crisis may meet or exceed that of our experience in WWII.
Monetary – Federal Reserve
Just as the Congress rapidly responded to the fiscal needs of the country, the Federal Reserve acted with great urgency. Since the epicenter of the great financial crisis was securely within the Federal Reserve’s jurisdiction, they were both quick and creative with their programs. That speed and imagination likely averted a depression – a reality that almost certainly drove their methods of response in this crisis.
Again, due to the breadth and complexity of the monetary policy response (both here and abroad), I will not review each program individually, but instead provide a summary of the intent behind the actions, as well as some perspective on how unprecedented the policies truly are.
A quick primer: Central banks typically have two objectives (although they change from time to time): facilitate full employment and keep prices/inflation stable. Some might also add “don’t let financial markets cease to function” to this list. To achieve these two (three) goals, central banks have three main tools: a policy interest rate that they can raise or lower, a balance sheet that they can use for outright purchases or sales of securities, and finally there is a litany of what we will call liquidity facilities/policies that help make sure the plumbing of the financial system operates as intended. Let’s take a look at how our Fed has acted on each of these three fronts:
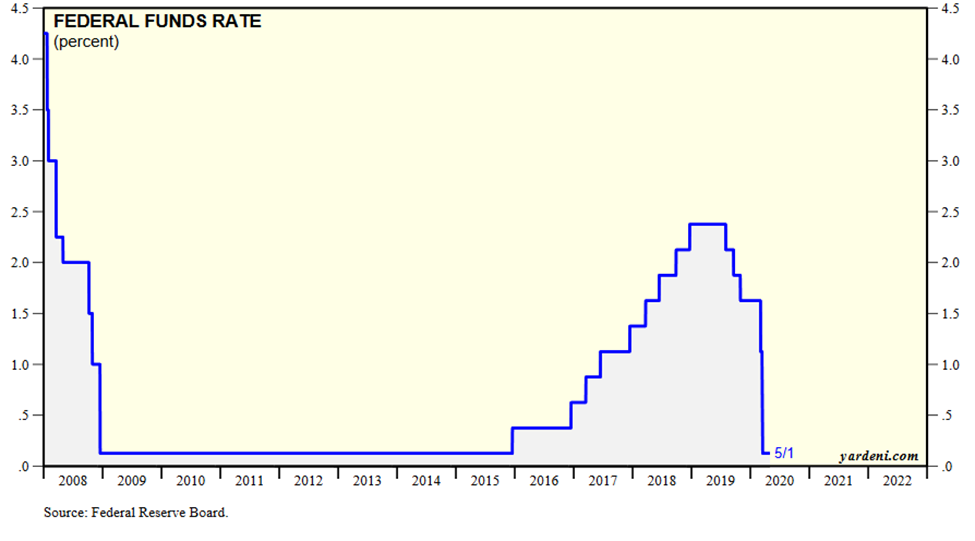
On the policy rate side, the Fed came out swinging – first, they did an intermeeting cut on March 3rd of half of one percent (50 basis points). An intermeeting cut is not without precedent, but in the over 100-year history of the Fed, it has only happened eight times (1994, 1998, 3x in 2001, 2007, 2x in 2008). Their final rate cut took interest rates to zero and was the first such cut to 0.00-0.25% since the financial crisis. Chart on Fed Funds (policy rate) below.
The balance sheet policy response has been substantially more dramatic than that of rate policy. Through two separate pronouncements, the Fed informed markets that they would effectively buy as many treasury and mortgage-backed securities as required to achieve their mandates. This open-ended policy differs materially from past quantitative easing (QE) programs which included details about both the pace and duration of purchases. Previously, the most aggressive pace of QE occurred in the third and final round (QE3). At its peak, QE3 allowed for $45 billion in monthly purchases of treasury securities.
Since this new quantitative easing program began, it has averaged $43.7 billion in purchases PER DAY!

Suffice it to say, the Fed is fully committed to supporting the treasury market. They’re also committed to supporting the mortgage market, corporate debt markets, and even select consumer debt markets. The $1.4 trillion in purchases mentioned above only includes US Treasury securities, the total balance sheet expansion since the Fed began these programs is $2.4 trillion!

The ‘liquidity and other provisions’ portion of the toolbox is the broadest and arguably the most integral to an orderly financial system. The complexity of these programs also makes them a bit boring, but the good news is they almost always have an associated acronym. In the heart of the mid-March panic, it felt like a new program was announced every single day. Here is a brief run-down of the policies enacted so far:
- Primary Dealer Credit Facility (PDCF) – Lending to securities firms at .25% for 90 days to keep markets credit markets functioning
- Money Market Mutual Fund Liquidity Facility (MMLF) – provides liquidity to money market funds facing a cash crunch
- Repo Operations – These began in late 2019, and were quickly ramped up to as much as $1T in overnight repurchase operations aimed at providing access to cash and defending their policy rate
- Total Loss Absorbing Capital Requirement Relaxation (TLAC) – relaxing capital requirements for banks to encourage lending
- Primary Market Corporate Credit Facility (PMCCF) – Direct lending to corporations, with restrictive terms on buybacks and dividends
- Secondary Market Corporate Credit Facility (SMCCF) – Allows for the direct purchase of investment-grade corporate bonds, and exchange-traded funds
- Commercial Paper Funding Facility (CPFF) – Allows for the purchase of commercial paper and municipal bonds
- Term Asset-Backed Securities Loan Facility (TALF) – Allows for the purchase of asset-backed loans that are collateralized by consumer loans (student loans, auto loans, and credit cards)
- Municipal Liquidity Facility – Direct lending to state and local governments
- International Dollar Swap Lines – these facilities allow foreign central banks to put up collateral in exchange for US dollars. They are standing facilities with our allies, but they’ve now been expanded to effectively every other central bank except for China.
The Main St. and municipal lending facilities were included in the list above even though they are very clearly an entirely separate and new avenue of Fed policy. More news is forthcoming on those programs as they roll out in the coming weeks and months.
We hope this review of the fiscal and monetary actions to the crisis was a helpful summary of the unprecedented response. If you would like to discuss any of the programs or the policy outlook(s), please let me know. For now, the Fed and fiscal authorities intend to do whatever it takes to keep our financial system functioning. The consequences of their actions will be debated from now until eternity, but the simple truth is that doing nothing would have had catastrophic results.
Earnings and The Economy
Most statements about the condition of the economy these days conclude with ‘… the most ever’ or ‘… the lowest ever.’ So, you may find it odd that we don’t have a single one of these ‘unprecedented’ data sets in our newsletter this quarter. Why? Well, to be blunt, macroeconomic data right now is as shocking as it is useless. Until the shutdowns ease broadly, the data is telling us something we already know; the economy is closed for business. As rates of change and trends materialize, the data will be extremely descriptive of what the recovery may look like, but unfortunately, that will take time.
So instead of presenting a detailed analysis of unemployment claims or retail sales, we will focus this section on the qualitative nature of corporate earnings season.
During earnings season, we typically get information about the recently ended quarter, color about operational initiatives/challenges, and generally some form of guidance about what the next quarter or year might look.
Luckily for us, the end of the first quarter just so happens to have overlapped with the most significant disruption to global business in modern history. This fact makes the results from the previous quarter and the guidance on future quarters less meaningful than normal. But management’s qualitative discussion of operations and stake-holder behavior has become an incredibly valuable piece of information. Here are a few excerpts from earnings releases and conference calls that highlight the most relevant emerging themes.
- Amazon (AMZN): Beginning in early March, we experienced a major surge in customer demand. Particularly for household staples and other essential products, across categories such as health, and personal care, groceries and even home office supplies. At the same time it's a lower demand for discretionary items such as apparel, shoes, and wireless products. This large demand spike created major challenges in our operations network
- Omnicom Group (OMC): While we expect the pandemic to affect substantially all of our clients, certain industry sectors have been affected more immediately and more significantly than others, including travel, lodging and entertainment, energy and oil and gas, nonessential retail and automotive. Clients in these industries have already acted to cut costs, including postponing or reducing marketing communication expenditures. While certain industries such as healthcare and pharmaceuticals, technology and telecommunications, financial services and consumer products have fared relatively well to date, conditions are volatile and economic uncertainty cuts across all clients, industries and geographies. Overall, while we have a diversified portfolio of service offerings, clients and geographies, demand for our services can be expected to decline as marketers reduce expenditures in the short-term due to the uncertain impact of the pandemic on the global economy
- Alphabet (GOOGL): For our advertising business, the first two months of the quarter were strong. In March, we experienced a significant and sudden slowdown in ad revenues. The timing of the slowdown correlated to the locations and sectors impacted by the virus and related shutdown orders.
- Target (TGT): Month-to-date in March, overall comparable sales are more than 20 percent above last year, with comparable sales in Essentials and Food & Beverage up more than 50 percent. During that same period, comparable sales in Apparel & Accessories are down more than 20 percent compared with last year.
- McDonald’s (MCD): In China, approximately 25% of restaurants were closed in early February. By the end of March, substantially all restaurants had reopened. However, the market continues to experience a reduced level of demand as consumers have not fully return to their pre-COVID routines resulting in negative comp sales since the initial outbreak in late January. Comp sales were down over 20% in the first quarter and trends have improved in April to negative mid-teens.
- Caterpillar (CAT): In April, we raised $2 billion of incremental cash by issuing new 10 and 30-year bonds and arranged $8 billion of additional backup facilities to supplement the Company's liquidity position. We've reduced discretionary expenses, including consulting, travel and entertainment. We suspended 2020 based salary increases and short-term incentive compensation plans for most salary management employees and all senior executives.
- Caterpillar (CAT): I don't anticipate a permanent impairment in our business. The old -- I believe it is my 5th I think oil cycle in my 40-year career and when things are really good people think it will never get worse again and when things are really bad they think it will never get better
- Honeywell (HON): Starting with Aerospace, we expect more than a 50% decrease in global air transport flight hours and more than a 40% decrease in global business aviation flight hours in the second quarter based on industry sources, which will significantly impact our commercial aftermarket businesses
- YUM! Brands (YUM): I really do think the few months that we're in the middle of right now are accelerating a lot of trends in the business that would have taken years to take hold like digital order and pay and things like and delivering technology and all the stuff that everybody is talking about
- American Airlines (AAL): Never before has our airline, or our industry, faced such a significant challenge.
- Cummins (CMI) On the supply chain side, we've been dealing with disruption in the supply chain really since China shutdown in early February. I think our global network has proved very valuable to us in that we've been able to move production around and we've been able to mitigate a large number of issues.
- Warren Buffet: ‘Never, ever bet against America’
Aside from operational challenges/opportunities, the most prolific trend is the massive expansion of corporate credit. Since the beginning of the crisis, companies have tapped revolving credit lines and issued a flurry of new debt. Commercial and Industrial loans have skyrocketed from $2.2T to $3T in about two months! For some perspective, that $800 billion increase is the same magnitude of expansion that was experienced over the 5-year period from 2014-2019.

While debt is undoubtedly a stigmatized area of finance, there is a definite silver lining in the fact that companies were actually able to get their hands on cash. By making it so that essentially any company could get access to very low rates, the Fed took the wide-spread bankruptcy scenario off the table (for now).
No one can be sure what the world will look like six months or a year from now. Certain companies will likely be so fundamentally changed that they cease to exist in their current form. Others will be in a place to opportunistically emerge stronger than ever. The question we must grapple with as investors is to what degree will the carnage of the failed companies impact the path of the survivors. Our economy is so intricately intertwined that we find it difficult to think that any one sector can operate to its fullest potential while others are in calamitous decline. Our most important assessment going forward will be the degree to which capex cuts and layoffs impact the consumer’s propensity and ability to spend.
Energy Markets
In normal times, the drama in the energy markets would dominate the news. Plenty of news coverage has been initiated, but the magnitude of the declines and the knock-on effects to other areas of the economy are yet to be fully understood. In this section, we’ll briefly review the supply and demand dynamics that are currently wreaking havoc in our energy industry.
Supply
While the shale revolution has been an unquestioned success for consumers, it has been a source of major volatility for the energy industry. The expansion of horizontal drilling caused a boom in the late 2000’s and early 2010’s that has since met an abrupt bust. That bust has largely been due to the unbelievable output growth derived from the technology.
You’ll note that output fell in tandem with the oil price collapse as the period of oversupply began in early 2014.

During that short-lived contraction, only the least viable wells were shuttered, while the most productive wells continued to gush. Those productive wells have outperformed, and despite the pull-back in capital spending, US production reached new records in the final months of 2019.
On March 8th, the Saudis and Russians added insult to injury on the supply side of the ledger by initiating a price-war. They played chicken for about a month, drove the price substantially lower, and have now declared a fragile truce. With so many countries and companies desperately reliant on continuing to produce oil, an easy fix is likely difficult on the supply side.
Demand
As the economic realities of the coronavirus crisis set in, it became clear that substantially less energy would be consumed for a period. By many estimates, this shut-down phase has meant a 90% decline in airline traffic and a 60% decline in miles driven. The question now is what does a bounce back look like, and if the market was oversupplied when global activity was humming, what does an oversupplied market look like if activity resumes at 60%, 70%, or even 90% of its former peak?
Politics (briefly)
It seems like an almost absurd reality that we are only 6 months away from a presidential election. We plan on covering the election and the potential market/economic implications in later newsletters but couldn’t help throwing this interesting chart of consumer comfort into the mix.

Before the crisis, democrats and republicans were living in totally different worlds (no surprise there). But the prevalence of COVID-19 in largely blue jurisdictions has taken consumer comfort for democrats to new lows. Republicans, on the other hand, remain about as confident as they did shortly after the election of Donald Trump.
In normal times, measures of consumer comfort/confidence are direct feed-ins to economic expectations. But as we inch closer and closer to the election (November 3rd), these gauges will become critical. It is no secret that weak reads of consumer measures typically lead to a shift in the incumbent party. I’m sure the political strategists advising these campaigns are entirely aware that no president (or his party) has ever survived an election that occurred in a recessionary year. Will an exogenous shock-induced recession be a different story?
Technical Review
S&P500
The market remains in a multi-year consolidation. Since bottoming on 3/23, we’ve re-entered the range between 2200 and 2900. We expect to live in this range for a significant period as the damage from the crash is repaired. Mega-cap stocks have bounced the most and are masking broad weakness within the index. As of 5/4, the median stock had recovered about 39% of their peak to trough decline, while the market had recovered 52%. Most of this weakness is centered in cyclical areas that are typically associated with value and small market capitalization.

GOLD
While the crash in March took the stock market down the hardest, it didn’t spare other areas typically associated with safety/income such as investment-grade bonds, municipal bonds, real estate investment trusts (REIT), and gold. This ‘dash for dollars’ was quickly alleviated by monetary policy actions, and these areas have since snapped back to varying degrees.

