All of us at Mader Shannon hope that you were able to make the best of 2020 and that your first weeks of 2021 are off to a pleasant and productive start. Our newsletters are frequently centered around the “what happened, and why?” types of questions that markets and economies are so skilled at producing. But we anticipate that you are as sick of talking about last year as we are, so Austin and I will focus this note on getting ‘back to basics’ with an in-depth review of the inputs and themes that are sure to drive markets over the coming year.
We hope that our management provided you with some peace of mind during the tumultuous year. If you would like to discuss your results or our outlook, please let us know.
- Kyle
Fundamental Review
It was a tough year for U.S. businesses. In the midst of a global recession, aggregate revenues for the companies in the S&P 500 Index will likely post a decline of 3% compared to 2019 – the first decline in half a decade. The bottom-line impact has been more pronounced. An array of cost headwinds - including supply chain disruptions, staffing issues, and tariff implementations - squeezed profit margins, and index earnings are set to fall 14% for calendar year 2020.
The recovery, though, is well underway. The trend in sales, margin, and income has strengthened throughout the last 6 months, and all look set to continue rising in 2021. Should reality conform to consensus expectations in the coming year, earnings will grow more than 20%, exceeding the level reached before the recession hit.

With widespread lockdowns and high unemployment, the economic outlook last spring was anything but bright. But the pace of recovery since has exceeded nearly all expectations – except, perhaps, the expectations implied by stock prices. Index-level equity valuations have risen to their highest point since 2000.

We won’t be so bold as to say whether such high valuations are appropriate or not. They’re certainly out of the ordinary. But if you’re determined to find justification, allow us to present a few thoughts on the subject. First, faster growth should be associated with higher multiples. After all, the decades old dilemma of growth vs. value stocks centers around the conundrum that fast-growing companies are more expensive than their slow-growing counterparts. Likewise, earnings growth in 2021 and 2022 is expected to accelerate from recessionary levels and is being rewarded with a valuation premium.
Second, interest rates are historically low. Low interest rates help businesses grow faster (see above), but they also force investors to take more risk to achieve their return objectives (e.g. invest in stocks instead of low-yielding bonds), which contributes to higher prices. This isn’t a new story. In a 2016 interview, Warren Buffett quipped “If you had zero interest rates and you knew you were going to have them forever, stocks should sell at, you know, 100 times earnings or 200 times earnings.” Of course, no one really believes interest rates can stay this low forever. But given the actions of the Federal Reserve over the last 12 months, they probably believe it more than they did last December. The Fed has committed to keeping short-term rates at 0% for the foreseeable future, with the majority of FOMC members expecting no hikes until at least 2024.

And finally, it’s hard to deny that current valuations are – at least to some extent – a reflection of the extraordinary efforts by fiscal and monetary authorities to suppress economic cyclicality. In recent years, both legislators and central bankers have shown an increased willingness to intervene when times get tough. Their coordinated response to COVID was unprecedented in terms of magnitude, and undoubtedly helped support markets and bring an early end to the recession. It seems a growing majority in Washington, with inflation now dead and buried for 20 years, have decided high levels of deficit spending and monetary stimulus are an effective and low-risk way to halt economic downturns. Time will tell whether their aggressive actions will have unintended consequences.
Inflation
With abstract concepts, we tend to distill our views through the lens of our personal experiences. The notion of inflation is a textbook example of this phenomenon. A few examples of times and experiences:
- A German living in post-WW1 Germany (Weimar Republic) would likely fear that their wages today might not cover the cost of a loaf of bread tomorrow, and that their savings may become worthless due to the dramatic increase in the supply of Reichsmarks.
- Americans in the late 1970s worried that energy and food shortages might be imminent or that double-digit interest rates may stifle their ability to grow a business or buy a home.
- A young person in the United States today might wonder why their pack of gum has 12 slots but only 10 pieces.
Asking each of these people how they 'feel about inflation?' would understandably yield outcomes varying from outrage and disgust to ambivalence. Due to that level of subjectivity, we will be sticking to high-level data that describes/projects the broad trend in consumer/industrial prices.
Before reviewing the trends in inflation, let’s first make sure we grasp what that dreaded “I” word really means. The overly simplified definitions of inflation are: ‘too many dollars, chasing too few goods’ or ‘a passing-on of rising costs to consumers.’
Put even more simply, you get inflation one of two ways – consumers are willing to pay any price (causing sellers to raise prices), or a seller of goods raises prices due to rising production or input costs.
Those scenarios represent what is known as demand-pull and cost-push inflation, respectively. And they embody the elementary economic principles that we all grapple with daily, such as the scarcity of resources, supply and demand, and economic regulation. (I promise, this concludes the Econ 101 material).
OK, so now that we have a firm grip on where inflation comes from…. how should we measure it?
Measure of Inflation
The gold standard of inflation measurement in the United States is the Consumer Price Index (CPI) published by the Bureau of Labor Statistics. This index seeks to describe the annual rate of price inflation in the economy based on a set basket of goods. The two most-watched versions of this index are Headline, which includes every item in the basket, and Core, which excludes the most volatile categories (Food and Energy).

No matter how you slice it, the Core basket of goods has been incredibly stable at about 2% annually over the past 20 years. This remarkable stability in prices is somewhat unprecedented in the modern era and has arguably come from a few structural forces.
Structural Dis-Inflation
The most distinguishable driver of inflation over the past 50 years is the demographic shift in post-WW2 America.
As the Baby Boomers came of age in the 1970s and 1980s they formed households and fueled an explosion in the labor force. Unsurprisingly, this boom in economic potential led to a meteoric rise in inflation and interest rates.

Although, to be more comprehensive, a catastrophic rise in the cost of energy and a festering Cold War with the USSR also contributed to that generation's inflation spike. Since the 'new entrant' share of the labor market has stabilized over the past few decades, so have inflation pressures.
The ever-shrinking cost and expanding availability of technology is another structural force on prices. Since 2006, the CPI price component for I.T. Hardware and Services has fallen by about 50%. And, as you can imagine, that is an extension of the trend lower since the late 80s.

Cheaper technology hardware and services depress prices in two main ways. It makes workforces more productive and markets more efficient, thus lowering input costs for businesses. And in some situations, it diminishes the need for expertise in (or the outright existence of) specific fields, which reduces aggregate wages.
How do we feel about low inflation?
The desirability of inflation is radically different depending on which type of entity you ask. The four major groups and their high-level view of inflation are as follows:
- Individuals: Under both the cost-push and demand-pull inflation models, individuals tend not to be thrilled. Cost-push inflation is incredibly unpleasant because it implies rising costs for consumers without any assumed increase in wages. However, some inflation is helpful for individuals with the prospect of rising wages and existing debt.
- Businesses: The cost-push scenario is also generally unsavory for businesses because their margins are likely being squeezed by higher input costs (unless the company is selling inputs - think commodity producers). Demand-pull inflation is acceptable for businesses so long as the firm has pricing power and can meet demand while satisfying their labor costs.
- Central Banks: One way to think about how central banks view inflation is to consider the following: If the economy is a river, and businesses/individuals are boats/swimmers, inflation is the current. Certain boats/swimmers may move faster or slower at times due to demographics or business cycles, but the underlying current keeps things moving forward. Central Banks view their job as keeping the flow ‘just right’ because if the current is going too fast or too slow, undesirable consequences may follow.
- Governments: On balance, sovereign currency issuers don’t mind mild inflation so long as their currency is stable/respected globally, and social unrest is not a factor. To the extent that a country issues debt to foreign holders, a bit of inflation is a good thing, as the debt can be extinguished with future, depreciated currency.
Inflationary Signals – Where is inflation headed?
This multi-trillion-dollar question has been met by eager economists and forecasters with the rabid response of ‘HIGHER, HIGHER, HIGHER!” over the past ten years (with astounding failure). And while I do not plan on joining them today with that prediction, inflationary trends are certainly materializing.
Let’s take a look at current market expectations and the policy realities that may drive those expectations.
There are many ways to gauge market expectations for future inflation. I’ve selected the following for this review: Treasury Inflation Protected Security (TIPS) and US Dollar Swap Forwards. Both are real financial products, with real money influencing their trends.

Detailed explanations of each market/security aren’t necessary for this exercise; instead, focus on the trajectory (rising = higher inflation expectations). Both indicators are focused about five years into the future, and both are setting new highs versus their pre-pandemic readings.
Another way to gauge inflation expectations is to think about the purchasing power of a currency. The US Dollar index is shown below. If your currency is declining in value, it takes more of it to buy the same amount of stuff. So all things equal, a falling value indicates higher inflation expectations.

As you can see, the US dollar is making new multi-year lows versus our largest trading partners' currencies. And while movements in currencies reflect far more than inflation expectations, it's an inescapable fact that a falling currency equals diminished purchasing power.
On the policy side, we need to check in on the US Federal Government and Federal Reserve.
In response to the pandemic, the US Government has provided immense accommodation to the US economy. That accommodation has been paid for by issuing debt. The chart below is the annual federal deficit (amount to be borrowed) versus the country's total output. The more negative the number, the larger the debt issuance.

As you would expect, higher indebtedness levels also tend to correspond with a less valuable currency and the potential for inflation. In the first and second quarter of 2021, the US Government will issue nearly $2.1 trillion in debt – roughly equal to 2014, 2015, 2016, and 2017 combined.
The Federal Reserve has also gotten creative in the face of the pandemic by taking interest rates to 0% and embarking on the most aggressive asset purchase program in their history. In many ways, the Fed's actions are actually facilitating the massive deficit spending by the US Government. The Federal Reserve balance sheet is shown below. Higher values = more accommodation.

In addition to the current accommodative stance of monetary policy, markets are also being promised that interest rates will remain low for the foreseeable future. And their policies are explicitly targeted at lowering the unemployment rate and keeping inflation at or above 2%.
This is not the first time our central bank and the federal government have charted an aggressive spending and accommodation path. Previous such examples have tended to occur during and immediately after major wars.

The logic behind inflation spikes during wars is threefold: resources are diverted from the private sector to the war effort (steel, rubber, labor, etc.), raising/deploying a fighting force and rebuilding after the war are both paid for with debt, and a pent-up demand effect causes a surge in spending once the conflict is resolved.
Conclusion
Over the next year, additional fiscal spending and a wave of pent-up demand are quite likely. Simultaneously, lingering effects from the US-China Trade War and supply-chain bottlenecks during the pandemic have caused shortages in raw materials and intermediate goods. As a result, it appears that all three criteria for a post-war inflation pop have been met.
On the other hand, structural deflationary forces from an aging workforce and technology-induced productivity enhancements are likely to persist and might be re-joined by cooperative global trade policy (also deflationary).
The wildcard in this balancing act is the will of global central banks to continue their accommodative stance in the face of what may look like ‘transitory pricing pressures.’
A few other fun facts/stats about inflation…
We anticipate a number of folks will say something to the effect of “yeah, but a coke used to cost 45 cents back in *whatever year*.” So we thought it would be fun to include a simple table showing what your dollar back in *whatever year* would be worth in today’s dollars. For example, if you made $30,000 in wages back in 1974, you should multiply that by 5 to convert 1974 dollars to 2021 dollars ($150,000). OR if you are reminiscing about that Coca-Cola that cost a dime in 1943, multiply it by 15 to convert to 2021 dollars ($1.50).

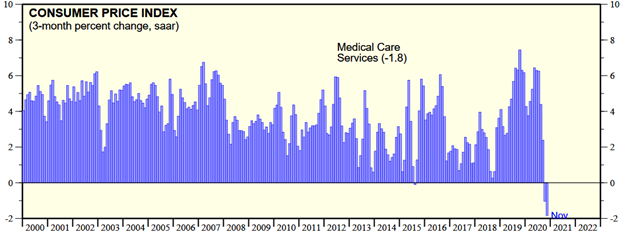
Another anticipated point of discussion on inflation (that we’re very interested in as well) is the fact that some things ALWAYS go up. Healthcare, childcare, and tuition are essentially a perpetual motion machine. The charts below show the monthly increase (on an annual basis) for those CPI components. For the first time in 20 years, we saw negative readings in each data set! (But I wouldn’t get used to it...)