As our notes throughout the quarter have discussed, the first half of 2022 was one to forget. Given the broad weakness in both stock and bond markets, we feel fortunate to have fared as well as we have.
We are confident that limiting the downside during this challenging period has set us up for success as economic growth and markets stabilize.
Our newsletter this quarter is again focused on the macroeconomic picture. Please let us know if you’d like to discuss markets, our positioning, and our strategy for navigating this difficult backdrop. We’re happy to be as transparent in our thinking as you would like.
Kyle
A Recession By Any Other Name
Deny thy father, and refuse thy name;
Or, if thou wilt not, be but sworn my love,
And I’ll no longer be a Capulet.
…
’Tis but thy name that is my enemy;
Thou art thyself though, not a Montague.
What’s Montague? it is nor hand, nor foot,
Nor arm, nor face, nor any other part
Belonging to a man. O! be some other name:
What’s in a name? that which we call a rose
By any other name would smell as sweet;
So Romeo would, were he not Romeo call’d,
Retain that dear perfection which he owes
A google search will tell you those lines appear in the third most popular of Shakespeare’s many famous scenes. Arguably though, the anguish-stricken plea of Juliet for her beloved Romeo to not be a Montague and her not to be a Capulet is the most broadly understood. In the end, the names we assign things can simultaneously be essential context to the story while also being almost entirely meaningless.
The growing fever of recession/slowdown chatter has us commiserating with Juliet’s frustration about how we collectively use labels. What’s the deal? Are we going into recession? Depression? Everybody seems to be infatuated with the status of economic growth. That’s why we led our quarterly note in March with a review of recession expectations and why we’ll do it again today.
Forecasting economic trends is nearly impossible, and pinpointing what drove an expansion and sowed its demise isn’t much easier. So for simplicities sake, the following adage is routinely invoked to differentiate between recessions and depressions: “When your neighbor is out of work, it’s a recession. But when you’re out of work, it’s a depression.”
Before we dive into the data and analysis of recessions, we better define the term. Much like the sweetness of Juliet’s rose, the term recession is straightforward. It simply means negative growth. But what growth is negative? Employment? Stocks? Retail Spending?
Enter Gross Domestic Product. It has been refined over the decades to explain the productive capacity of a country. It includes Consumption, Business Investment, Government Spending, and Imports/Exports. Depending on the country being analyzed, specific components can have outsized influence. For example, in the USA, consumption makes up about 66% of our country’s output, and investment makes up only 17%. On the other hand, in China, consumption makes up 39% of GDP, while fixed investment makes up 42%. The drivers of GDP growth (or contraction) for a given country are essential to keep in mind.
The ‘back of the envelope’ definition of a recession is two consecutive quarters of negative GDP. You’ll find that a satisfactory definition for cable news, but doesn’t it leave something to be desired? How much did the economy decline? Did/will it only last two quarters? Is this recession like some of the other bad ones I’ve experienced?
If you’re looking for a more refined definition of recession, the National Bureau of Economic Research is the group to watch. While they provide plenty of sophistication in their recession pronouncements, they also tend to not ‘call’ a contraction until well after one has started. Until we hear from the NBER, we’re on our own to compare and contrast economic activity with past recessions.
The white line below represents every dollar of US GDP over the past two years. At the end of 2019, GDP for the USA was the highest on record. The pandemic brought a sharp decline and a rapid recovery, and the post-pandemic period produced steady growth. This chart adjusts for any inflationary distortions.

In the first quarter of 2022, the US economy experienced its first decrease since the pandemic. So far, the decline is tracking some of the milder recessions on record. Interestingly, the recessions of 1957 and ’53 experienced among the most dramatic decreases in GDP but had below-average stock market declines. We omitted the Great Depression from this chart since the -26.3% decline is unrivaled in the country's history.
So how do stock markets typically fare in recessions? They tend to peak in advance of recessions and trough before the economic recovery begins.

While full market recoveries tend to happen before the official end of recessions, there are examples where stocks remained depressed for extended periods – most notably, the 2008 Financial Crisis and the Great Depression. On average, stocks tend to decline by about -29% in recessions. So far this year, the S&P 500 has been down by as much as -25%.
We’ve covered employment many times within these publications, but it bears repeating – every time we’ve had a recession in the USA, unemployment has risen. We got another strong reading today (7/8/22) on the US job market, and no signs of recession were present.

A discussion of the exceptionally healthy labor market would be incomplete without covering central banks. We’ll skip the inflation charts to keep from taking up your entire day – everybody knows it’s high. The primary consideration is that if inflation remains high, central banks will be pressured to raise interest rates further. All else being equal, higher interest rates slow economic growth.
Let’s have a look at the historic path of rate hiking cycles.
The white line represents the Federal Reserve policy rate, effectively the interest rate for overnight money/cash. Each line represents a period in which the Fed raised interest rates, typically a policy response to a period of rapid economic growth.
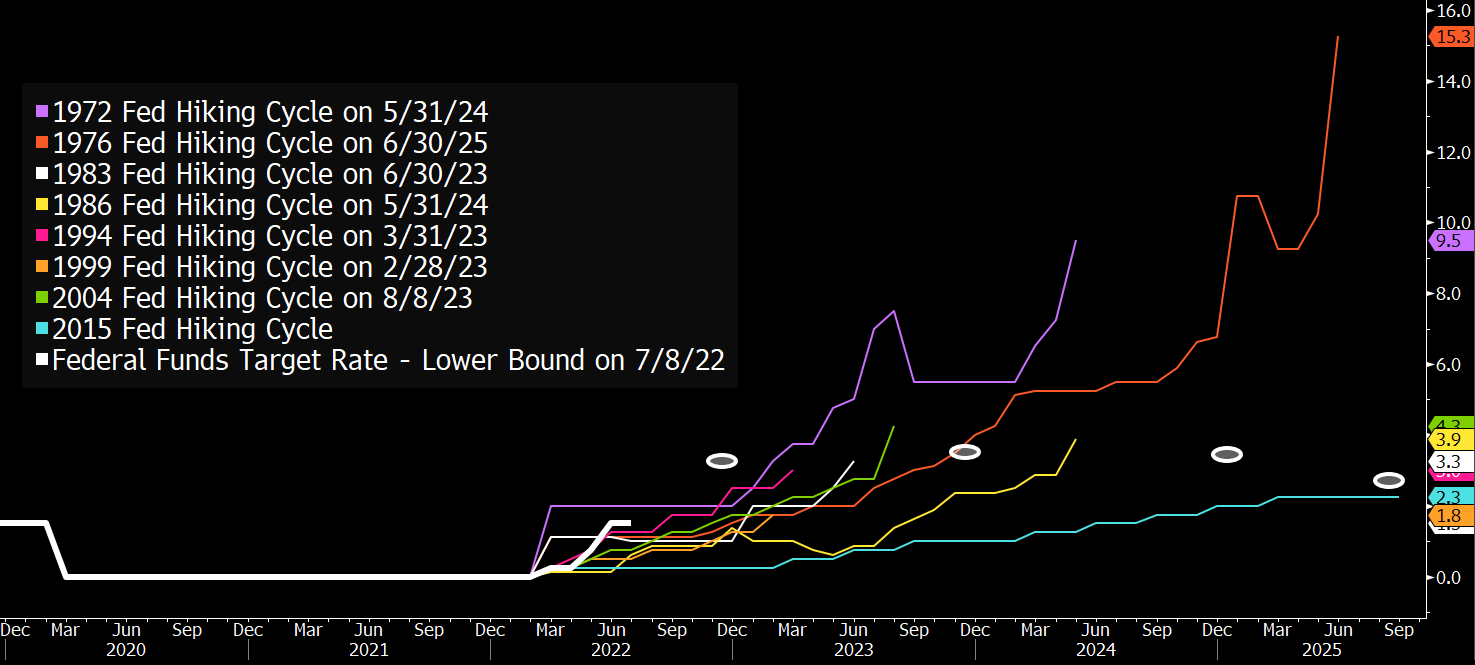
Two things to note: The path of future interest rates (white circles) indicates an expected policy rate of 3.5% by year-end 2022. If achieved, that would result in the fastest first year of a tightening cycle. Also, projections for 2023 and 2024 remain well below that of other periods in recent memory. If you look closely, slight rate cuts are penciled into the 2023 and 2024 projections. All projections are either derived from market-based measures or pulled directly from Federal Reserve publications.
An official indication of second-quarter GDP is due on July 28th, but economists far and wide have been assembling their estimates for months. After all, the government’s data for compiling official figures are readily available. One of the more reputable and consistent estimators of quarterly GDP is the Federal Reserve Bank of Atlanta. They provide the expected rate of expansion/contraction for each component of GDP. The mix can be messy, but it’s important to draw distinctions between what’s growing and what’s slowing.

The white line represents 2nd quarter GDP (at an annual rate), as seen by the Atlanta Fed. Their expectations have dropped throughout the quarter to -1.2%. You probably realize that if they’re right, it will mark the second quarter in a row of negative GDP growth. A recession!
But spend some time looking at the colored bars. Bars above the 0 line are positive contributors: consumer spending on services, non-residential investment, and net exports. The detractors are spending on goods, residential investment, and inventories.
First-quarter GDP was a similarly mixed picture – personal consumption and business investment were both positive, while inventories and net exports were significant drags.
So, two consecutive negative quarters of GDP might soon be in the books. Each report is uncharacteristically replete with potential explanations as to why maybe they weren’t so bad.
So then, do exceptions matter? Is a recession by any other name still a contraction in economic growth? Well, yes, it is.
But unlike the lovers in Shakespeare’s tragedy, nuance doesn’t have to be dead.
Some Noteworthy Developments
We live in extreme times. To be fair, it always feels extreme, and the word ‘unprecedented’ is an overused one. It’s common to tell ourselves the problems we face are more significant than those faced in times past, but few things are ever actually new. In many regards, though, this time really is different.
For one, US bonds are off to their worst start in at least 100 years. Ten-year Treasury yields rose from 1.5% in December to 3% at the end of June. The interest rate increase on corporate bonds has been even more extreme, as high yield credit spreads (the additional interest required by investors to offset the risk of default) have jumped more than 300 basis points in 2022. In summary, the place investors have historically gone for safety has provided nothing of the kind, with the Aggregate Bond Index down more than 10% in the first half.

As discussed earlier, the Federal Reserve intends to continue hiking rates for the rest of the year, which will be a headwind for bonds. However, if the market has already priced in the additional tightening, longer-term rates may have already seen their peak.
The National Federation of Independent Business releases a monthly report containing results of a survey of small business owners. For most of the last 5 years, those business owners have pointed to labor as the single most important problem facing their companies. The US labor force was tight before the pandemic struck, but now millions of workers have left the labor force, and employers are struggling to hire. There are 1.9 job openings for every unemployed person in America, a number unimaginable just two years ago.

This morning’s jobs report from the Bureau of Labor statistics confirmed the labor market strength, as the US economy added 379,000 jobs in June, and the U-6 underemployment rate dropped to 6.7%, the lowest ever for that data set.
A 2020 recession crushed domestic oil output. The Western world is rejecting Russian crude in response to the invasion of Ukraine. OPEC is unable to meet its production targets. Now, the world is facing an energy shortage, and Americans are paying more for a gallon of gas than ever before. Short of lifting the ban on Russian oil, there are no sustainable short-term solutions to the crisis. Saudi Arabia, OPEC’s de facto leader, has limited spare capacity to offset the production shortfalls of its peers. US producers are hesitant to ramp up spending and grow production after recent oil price collapses, and even if they did, it could take months to bring new wells online. In response, the administration has tapped the US Strategic Petroleum Reserve. The SPR was created in response to the 1973 energy crisis and has been used sparingly over the last 45 years. Until now.

With so many hard-to-solve problems on the supply side, any near-term correction in the energy shortage will likely have to come from a decline in demand.
Consumers are suffering from a bout of cognitive dissonance. They’re unhappy about inflation and concerned about the future, but they’re still spending money. Consumer sentiment, as measured by the University of Michigan, dropped to an all-time low in June. Retail sales, though, are still 8% higher than a year ago. The difference between what people are thinking and what they’re doing is nothing short of unprecedented.

Excess savings from pandemic stimulus payments have helped spending remain elevated even as prices rise. How long consumers are willing and able to pay up in the face of heightened anxiety remains to be seen.
Stocks may be off to their worst start to a year since 1970, but you can’t blame analyst earnings expectations for the weakness. Consensus forward earnings estimates for the S&P 500 still show expectations of above average profit growth over the next twelve months. Instead of analysts’ expectations, it’s investors’ confidence in those estimates that’s driving the market selloff. It’s normal for stock prices to lead earnings. It’s not normal for the two to diverge so dramatically. The forward price to earnings ratio of the S&P 500 has fallen from its 2020 high of 23x to less than 16x today, with most of the decline happening this year.
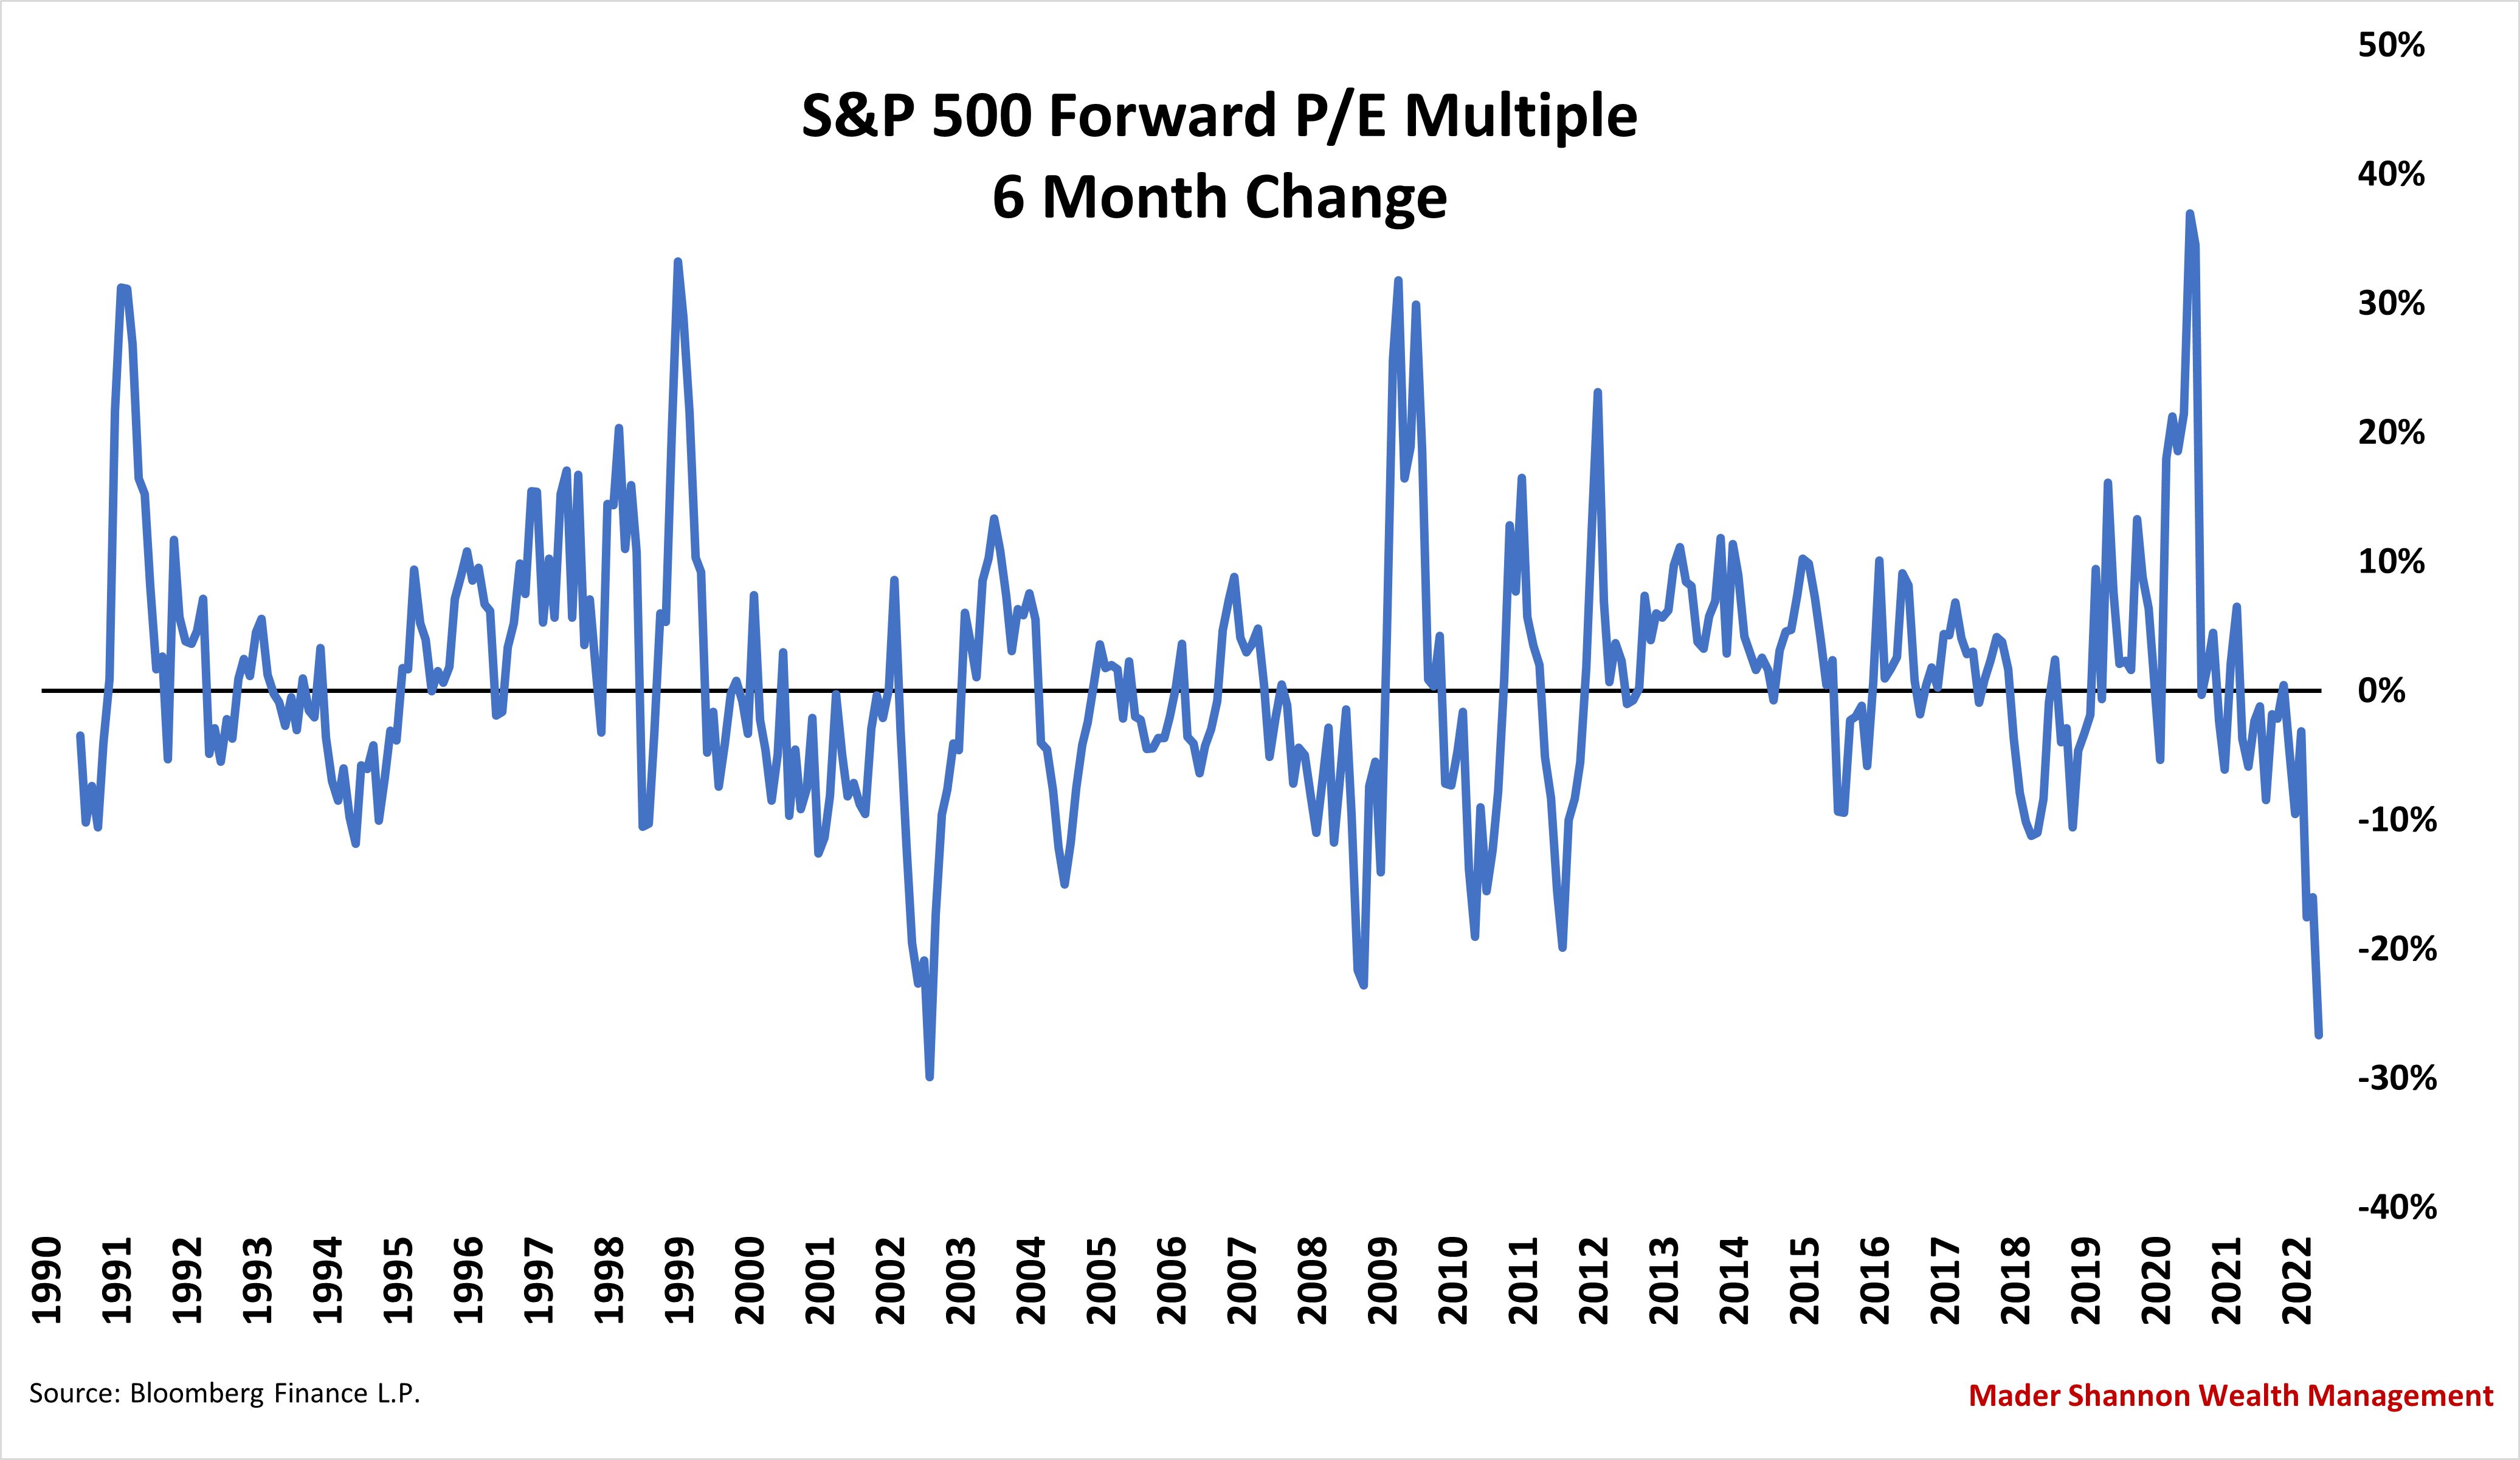
The valuation decline is extreme, and it might seem that either earnings estimates or market prices need correcting. But there’s no rule saying they must. With the S&P 500 now trading near 16x forward earnings, stocks are trading near their average valuation for the last 30 years.
So, if you feel that you’ve never seen markets move the way they’re moving, or if you’re conflicted about your financial position versus how you see the direction of the country or economy, you’re not alone. Take comfort in knowing that these times are unlike any other.
As an active manager, we feel exceptionally well suited for this moment. The environment is entirely without precedent - but this is not the first time our management style has met an unprecedented challenge. We’re confident that we can continue offering peace of mind and excellent risk-adjusted returns throughout this phase of slowing growth and increased market volatility.
Please let us know if you have any questions or would like to continue the conversation.
